Fig. 5.
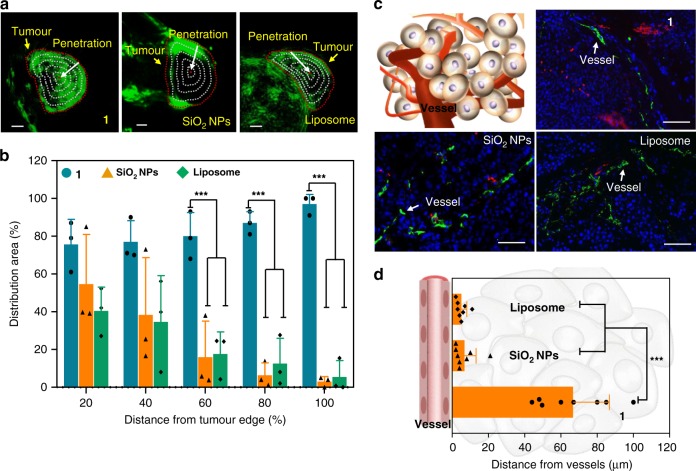
Tumour penetrations of TCASS. a 3D reconstruction PA images of tumour-bearing mice injected with molecule 1, SiO2 nanoparticles (SiO2 NPs) and liposome labelled by Cy. The degrees of penetration into the tumour were calculated. To better illustrate the penetration extent of molecule 1, SiO2 nanoparticles (SiO2 NPs) and liposome labelled by Cy, the tumour tissue was divided into five parts with identical radius intervals, which indicated the trend from the tumour edge to the interior (the red dashed circles show the tumour margin, and the grey dashed circles show the normalized distance from the tumour edge). b Quantification of the PA signal intensity. The PA intensity in the intratumoural distribution area between neighbouring polygons was normalized by the corresponding area. Data are presented as the mean ± s.d. (n = 3). ***p < 0.001, p values were performed with one-way ANOVA followed by post hoc Tukey’s test for the indicated comparison. c Frozen sections of tumour removed after treatment with molecule 1, SiO2 NPs and liposome labelled by Cy for 12 h. The tumour cell nucleus and vessels were stained with DAPI and FITC-tagged CD31 antibody, respectively. d Quantification of the penetrative distance of molecule 1, SiO2 NPs and liposome labelled by Cy from the tumour vessels. Data are presented as the mean ± s.d. (n = 8). ***p < 0.001, p values were performed with one-way ANOVA followed by post hoc Tukey’s test for the indicated comparison. Scale bar: a 2 mm; c 50 μm

