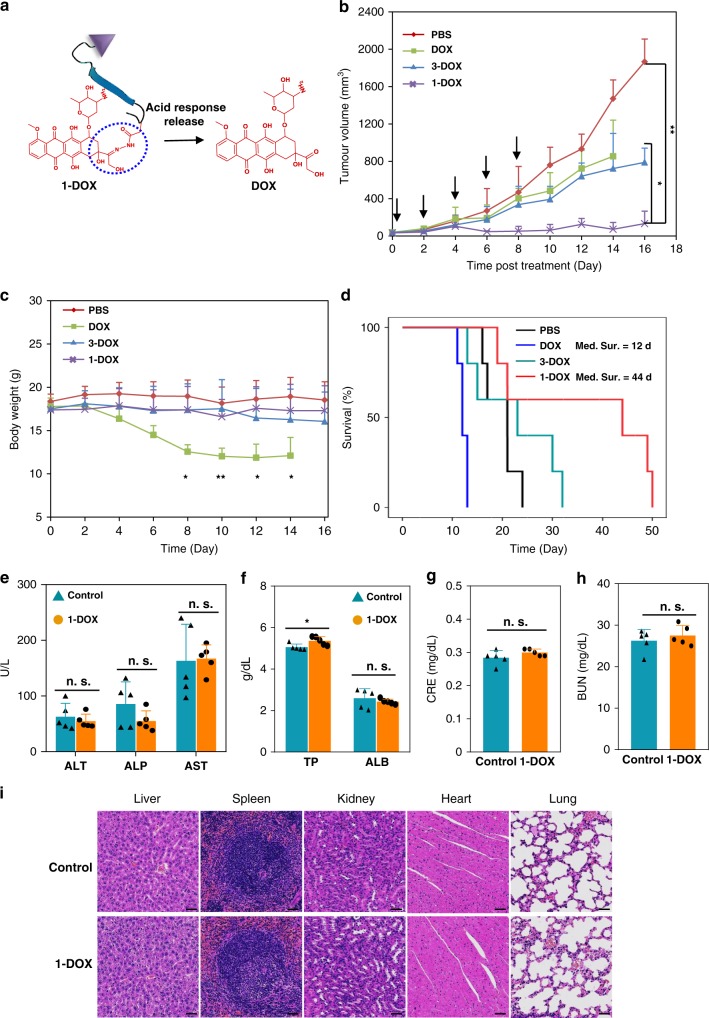
Fig. 6.
In vivo antitumor activity evaluation of TCASS. a Schematic diagram of molecule 1-DOX (positive for both recognition and self-assembly). b Tumour growth inhibition. c Body weight changes of H460 tumour-bearing nude mice after treatment with PBS, DOX (2.0 mg/kg), 3-DOX (an identical DOX dose of 2.0 mg/kg), 1-DOX (an identical DOX dose of 2.0 mg/kg). The black arrow indicates the administrated time point. d Kaplan–Meimer survival curve of H460 tumour-bearing nude mice. e–i Blood biochemistry and haematology data of the H460 tumour-bearing nude mice which were treated with molecule 1-DOX (an identical DOX dose of 2.0 mg/kg, once every other day for a total of five times). The control group was H460 tumour-bearing nude mice without treatment. e Major indicators of liver function, alanine aminotransferase (ALT), alkaline phosphatase (ALP) and aspartate aminotransferase (AST) levels. f Total protein (TP) and albumin (ALB) levels. The creatinine (CRE) (g) and blood urea nitrogen (BUN) (h) levels, important indicators of kidney function. i Histology evaluation of the major organs (liver, spleen, kidney, heart and lung) collected from the control group without treatment and molecule 1-DOX treatment group. Data are presented as mean ± s.d. (n = 5). P values were performed with the Cox Mantel log-rank test. n.s. means not significant, p values *p < 0.05, **p < 0.01, one-way ANOVA followed by post hoc Tukey’s test for the indicated comparison. Scale bar: 20 μm

