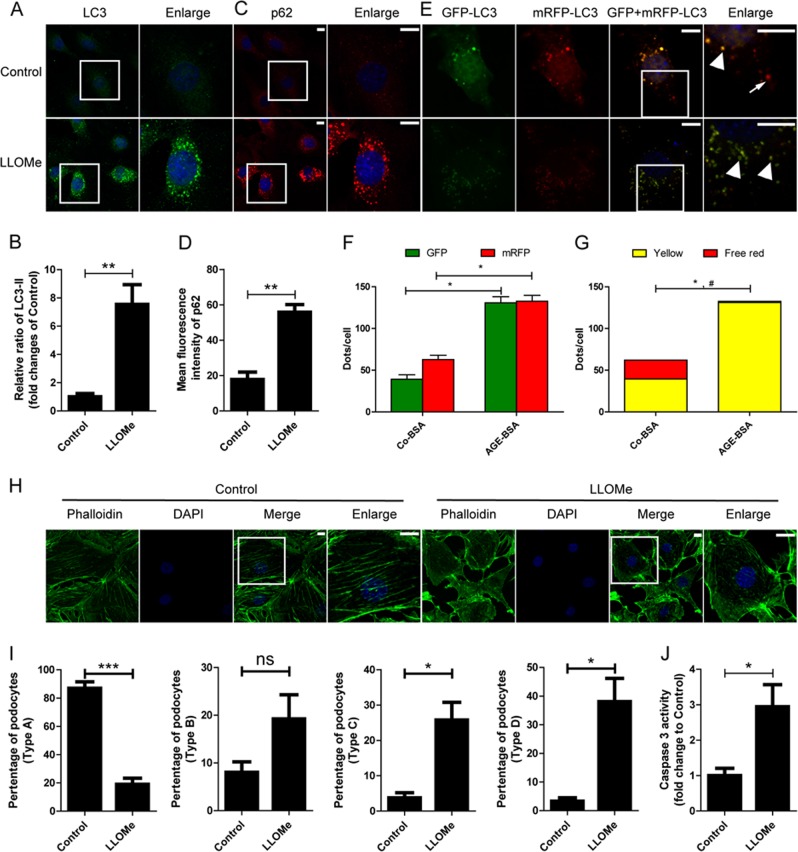
Fig. 11. Effects of LLOMe on autophagy and cellular injury after exposure of podocytes to AGE-BSA.
a, c Immunofluorescence staining of LC3 or p62 in podocytes after exposure to LLOMe. b, d Quantification of LC3 or p62 expression after exposure of podocytes to LLOMe. LLOMe induced an accumulation of LC3 or p62 in podocytes. e Fluorescence microscopic analysis of podocytes transfected with tfLC3 and treated with LLOMe. f Quantitative data for green or red puncta per cell. g Quantitative data for yellow puncta or free red puncta per cell. Autophagosomes (arrowheads), but not autolysosomes (arrows) were increased after exposure to LLOMe. h Immunofluorescence of F-actin cytoskeleton (green) showed loss of stress fibers and cortical actin staining after exposure of podocytes to LLOMe. i Quantification of the phalloidin staining. j The activity of caspase-3 was increased after exposure of podocytes to LLOMe. Scale bar, 10 μm

