
Fig. 2. Quantitative changes of autophagic vacuoles after exposure of podocytes to AGE-BSA at different concentrations for different times.
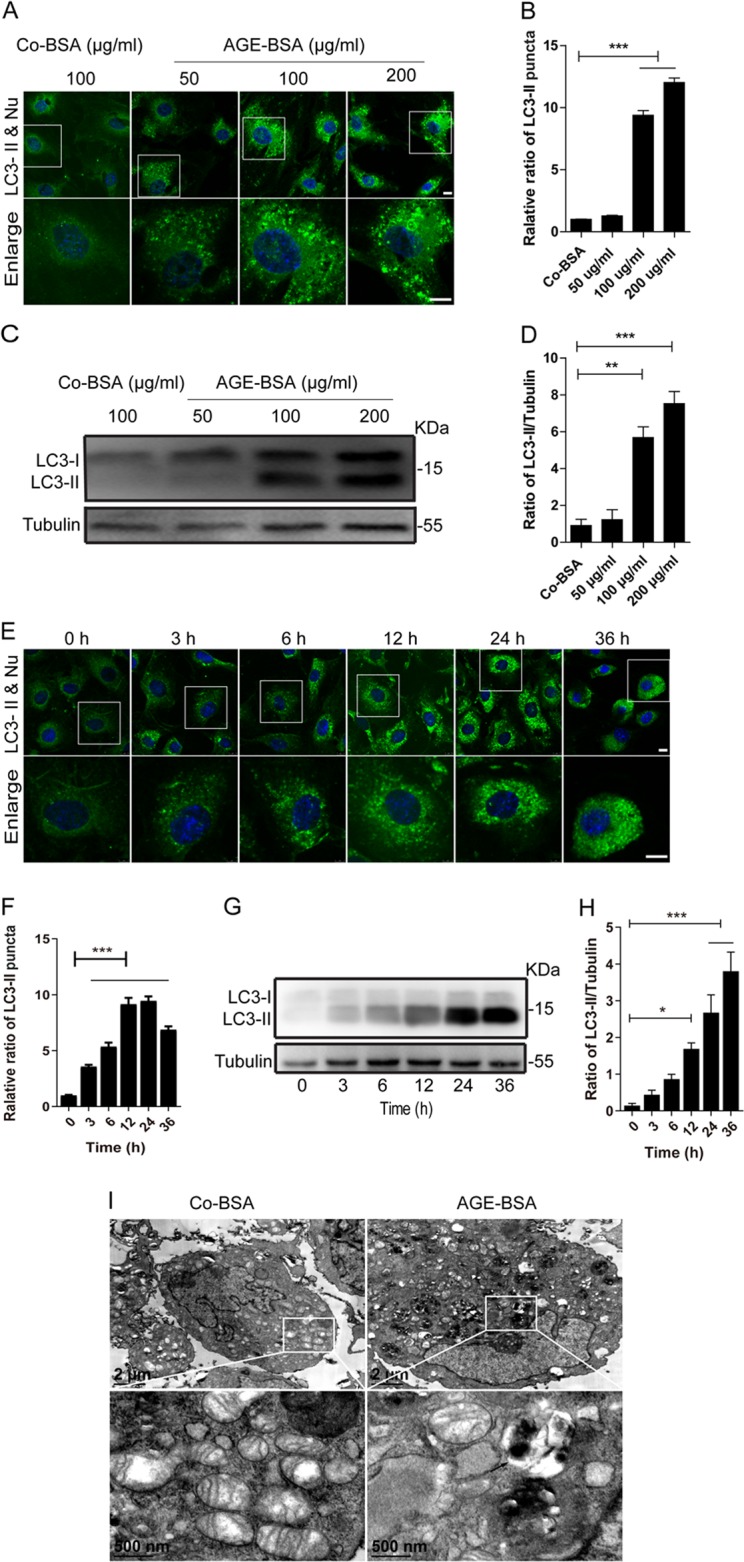
a, e Immunofluorescence staining of LC3 in podocytes after exposure to AGE-BSA at different concentrations and times. Scale bar, 10 μm. c, g Western blot analysis of LC3. b, d, f, h Densitometry was performed for the quantification, and the ratio of LC3-II to tubulin was expressed as the fold-change compared with the level in the control. i Ultrastructural images of autophagic vacuoles and mitochondria after exposure of podocytes to AGE-BSA for 12 h. Arrow indicates the autophagic vacuole. AGE-BSA induced the accumulation of autophagic vacuoles in a concentration- and time-dependent manner. *p < 0.05; **p < 0.01; ***p < 0.001