Fig. 5.
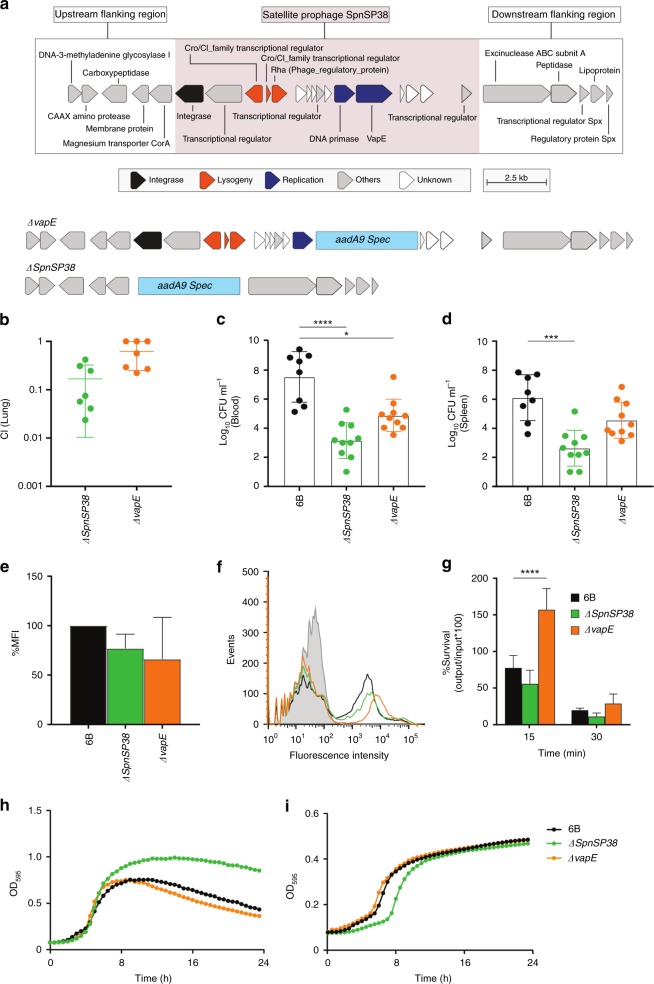
A satellite prophage is associated with virulence. a Upper part depicts the satellite prophage genes integrated within the BHN418 genome and flanking pneumococcal genes, and the lower part depicts the ∆vapE and ∆SpnSP38 mutants with the addition of the spectinomycin resistance cassette aadA9. b Plots of the competitive index (CI) for the ∆SpnSP38 and ΔvapE mutant strains versus the wild‐type strain in a mouse model of pneumonia. Each symbol represents the CI for a single animal and bars represent the median and range. c, d Mean bacterial colony-forming units (CFU) recovered at 24 h from blood (c) or spleen (d) homogenates after intraperitoneal inoculation of 5 × 10⁶ CFU/strain. Each symbol represents data for a single animal. e Mean fluorescence intensity (MFI) of C3b deposition on the surface of the wild-type and mutant strains as measured by a flow cytometry assay. f Example of a flow cytometry histogram for the C3b deposition data. g Bacterial survival in a neutrophil-killing assay (multiplicity of infection: 1 bacterium/100 neutrophils) represented as % CFU/ml recovered after 15–30 min incubation compared with the input bacteria. h, i Growth curves as measured by the optical density (OD) of wild-type and mutant strains cultured in Todd-Hewitt broth supplemented with 0.5% yeast-extract (h) or 100% human serum (i). Error bars c, d, e, g represent standard deviation and asterisks c, d, g represent statistical significance compared with the wild-type strain (two-sided Kruskal–Wallis test with Dunn’s correction for multiple comparisons) *p < 0.05; ***p < 0.001; ****p < 0.0001). Source data are provided as a Source Data file

