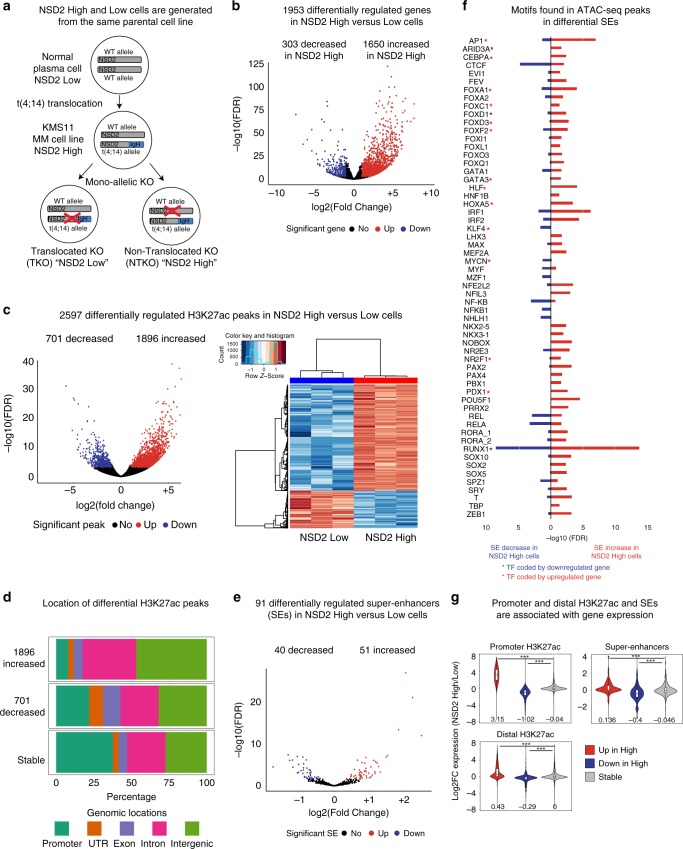
Fig. 1.
NSD2 overexpression leads to alterations in H3K27ac enrichment linked to changes in gene expression. a NSD2 Low and High isogenic cell lines generated from the patient-derived KMS11 t(4;14) Multiple Myeloma (MM) cell line: NTKO (non-translocated knockout) and TKO (translocated knockout) cells, which have the translocated allele or the endogenous NSD2 allele, respectively inactivated. MM multiple myeloma. b Volcano plot showing significant NSD2-mediated changes in gene expression (n = 5 independent experiments, FDR < 0.01, Wald test). Upregulated genes: 1650 (red, log2-fold change > 1); downregulated genes: 303 (blue, log2-fold change < −1). c Violin plot (left panel) and heatmap (right panel) showing significant NSD2-mediated changes in H3K27ac (n = 3 independent experiments, FDR < 0.01, Wald test). Decreased peaks: 701 (blue, log2-fold change < −1); increased peaks: 1896 (red, log2-fold change > 1). d Genomic locations of the differential H3K27ac peaks. e Volcano plot showing significant NSD2-mediated changes in super-enhancers (n = 3 independent experiments, FDR < 0.1, Wald test) called based on H3K27ac levels using ROSE. Increased super-enhancers: 51 (red) and decreased super-enhancers: 40 (blue). f Transcription factor motifs identified in 119 ATAC-seq peaks of increased (51, red) and decreased (40, blue) super-enhancers using TRAP(−log10 FDR). Red and blue stars indicate that the gene encoding the TF is respectively up-regulated or downregulated in NSD2 High cells. g Gene expression changes are associated with H3K27ac changes at promoters, distal H3K27ac and super-enhancers. H3K27ac up, down and stable red, blue, and gray in NSD2 High versus Low cells. Source data are provided as a Source Data file

