Fig. 3.
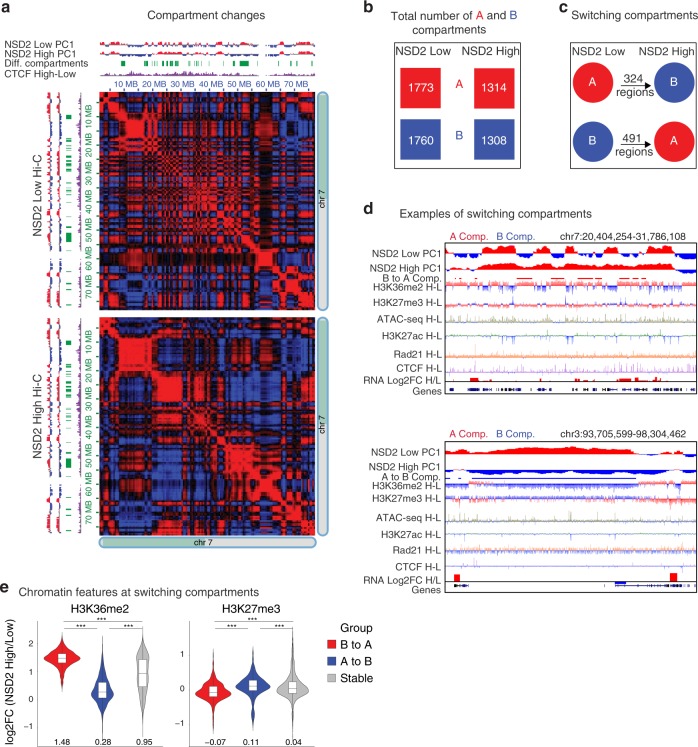
NSD2 overexpression drives A/B compartment switching. a Compartment weakening for half of chromosome 7 is shown in NSD2 High versus Low cells. Top and left: Eigen vector (PC1) for compartments A and B in red and blue, respectively. Switching regions are shown in green and in purple the subtraction of CTCF signal (NSD2 High–Low). Heatmaps represent the Pearson correlation of interactions in NSD2 Low (top) and High (bottom) cells. Positive and negative Pearson correlations between two loci are represented in red and blue, respectively. b Total number of A (red) and B (blue) compartments in NSD2 High versus Low cells. c Number of regions that switch compartments from B to A in (491 regions) or A to B (324 regions) in NSD2 High versus Low cells. d IGV screenshots show examples of regions that switch from A to B (top panel) and B to A (bottom panel) in NSD2 High versus Low cells. Eigen vectors (PC1), differential compartment switching, subtraction tracks of H3K36me2 and H3K27ac and expression for NSD2 High and Low cells are shown. Regions that significantly switch from B to A and from A to B are indicated in red (top panel, B to A) or in blue (bottom panel, A to B), respectively. H–L refers to subtraction of the ChIP-seq signal (NSD2 High–Low). e Changes in H3K36me2 and H3K27me3 levels within regions that switch compartment from B to A (red), A to B (blue), or are stable (gray) in NSD2 High cells. Log2-fold changes (NSD2 High versus Low cells) for H3K36me2 and H3K27me3 are shown. The median is indicated under the violins. Source data are provided as a Source Data file

