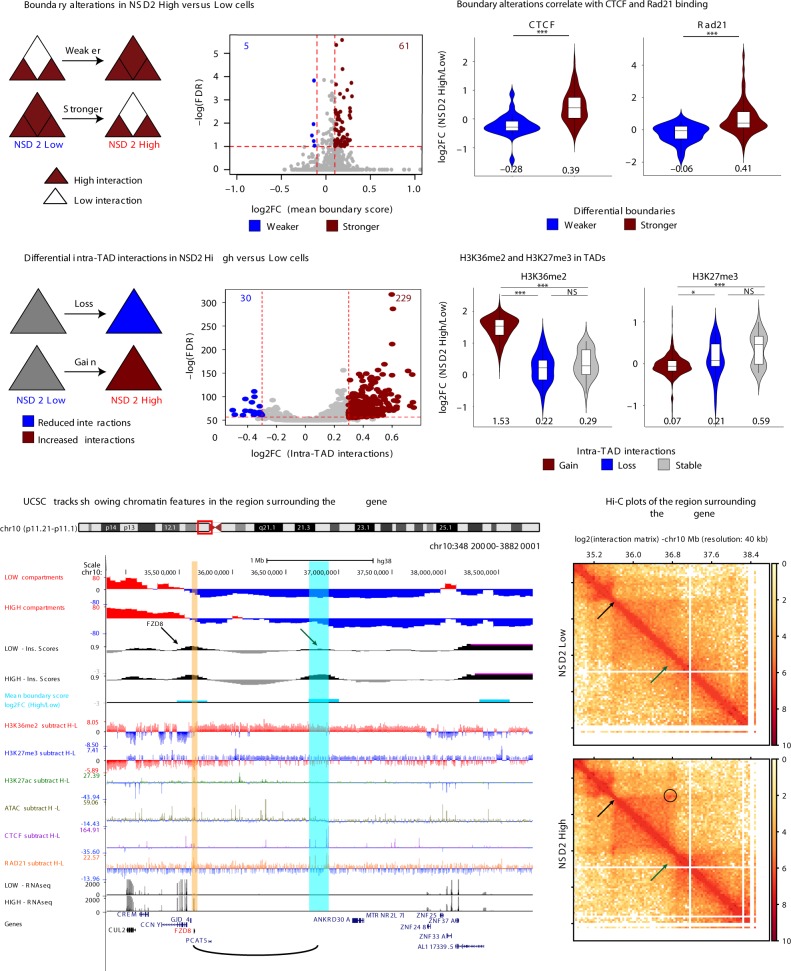
Fig. 4.
Changes in TAD boundaries and intra-TAD interactions. a Boundary alterations in NSD2 High versus Low cells. NSD2 overexpression is associated with increases (red, 61) and decreases (blue, 5) in TAD boundary strength (n = 2 independent experiments, cutoffs of absolute Log2-fold change > 0.1 and FDR < 0.05). b TAD boundary increases and decreases in NSD2 High versus Low cells are associated with increases and decreases in CTCF and Rad21 binding, respectively. The median is indicated under the violins. c Intra-TAD interaction changes in NSD2 High versus Low cells for overlapping TADs (1564). NSD2 overexpression is associated with gain (red, 229) and loss (blue, 30) of intra-TAD interactions (n = 2 independent experiments, cutoffs of absolute Log2-fold change > 0.3 and FDR < 0.05). d Changes in H3K36me2 and H3K27me3 within TADs that have increased (red), decreased (red), or stable (gray) interactions in NSD2 High cells. Log2-Fold changes (NSD2 High/Low cells) for H3K36me2 and H3K27me3 ChIP-seq are shown. The median is indicated under the violins. e UCSC tracks showing chromatin features in the region surrounding the FZD8 gene (FZD8 gene indicated in red and location highlighted by a yellow stripe) and the new contact that is formed by a strengthened boundary (blue stripe). The graphical representation of interaction between FZD8 and the super enhancer is shown as a loop below. H–L refers to subtraction of the ChIP-seq signal (NSD2 High–Low). f Hi-C plots of the region surrounding the FZD8 gene. Top panel: NSD2 Low, bottom panel: NSD2 High. Green arrow identifies the TAD boundary that is strengthened in NSD2 High versus Low cells. Black arrow indicates the FZD8 gene. Circle indicates a new loop between FZD8 and the boundary. Source data for violin plots in panels b and d are provided as a Source Data file

