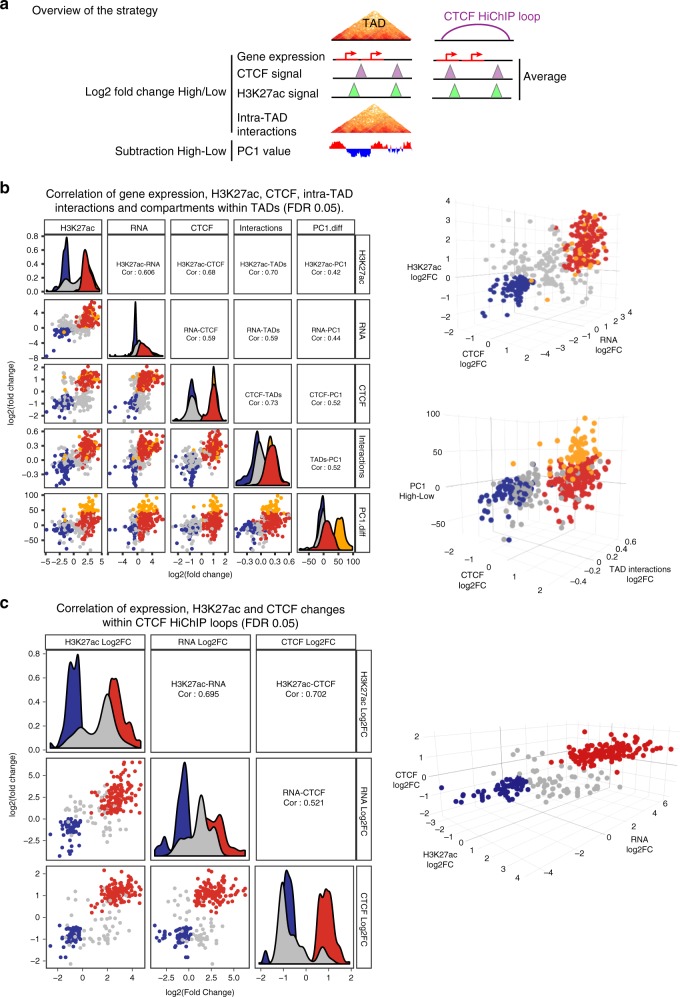
Fig. 5.
NSD2 overexpression drives concordant chromatin and transcriptional changes in insulated domains. a Scheme illustrating the strategy to identify chromatin and transcriptional changes within TADs or CTCF HiChIP loops that were filtered to have at least one differentially expressed gene, CTCF and H3K27ac peak. b Pairwise (2D scatter plots left panel) and three-way (3D scatter plots right panels) comparisons representing significant log2-fold-changes in gene expression, H3K27ac, CTCF, intra-TAD interactions, and PC1 values (representing subtraction of NSD2 High and Low levels) within TADs that have at least one significantly differentially expressed gene, CTCF and H3K27ac peak (FDR < 0.05). Concordant increased and decreased changing TADs are colored in red and blue, respectively. TADs that switch from B to A according to HOMER analysis (see the “Methods” section for details) are highlighted in orange. Pearson correlations are indicated. c Pairwise (2D scatter plots left panel) and three-way (3D scatter plots right panels) comparisons representing significant log2-fold changes of NSD2 High versus Low levels in gene expression, H3K27ac and CTCF within CTCF HiChIP loops that have at least one differentially expressed gene, CTCF and H3K27ac peak (FDR < 0.05). Concordant increased and decreased changing loops are colored in red and blue, respectively. Pearson correlations are indicated. Source data are provided as a Source Data file for b and c panels

