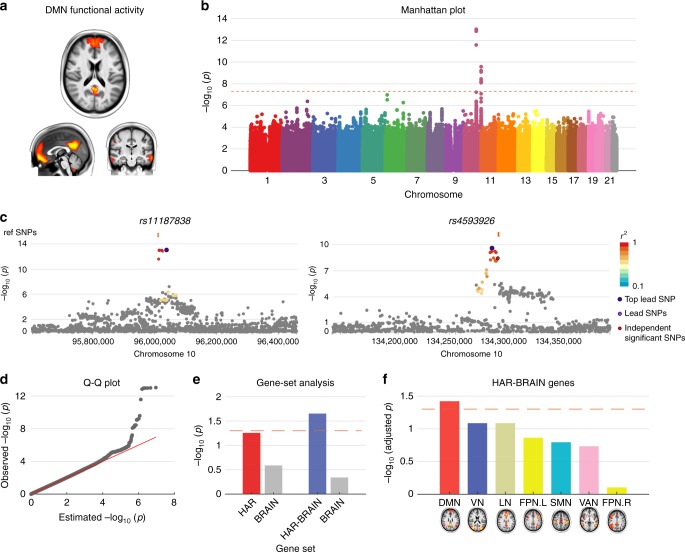
Fig. 4.
GWAS on DMN activity. a DMN component. b GWAS Manhattan plot showing –log10-transformed two-tailed p-value for all SNP (y-axis) and base-pair positions along the chromosomes (x-axis). Dotted red line indicates Bonferroni-corrected genome-wide significance (p-value < 5 × 10⁻⁸). c Regional plots of the two genomic loci (left, lead SNP: rs11187838 and right, lead SNP: rs4593926). d Q–Q plot of SNP-based p-value in panel b. Observed −log10 transformed two-tailed p-values of associations with DMN functional activity are plotted against expected null p-values for all SNPs in the GWAS. e MAGMA conditional gene-set analysis. −log10-transformed p-values of the associations between HAR/HAR-BRAIN genes and DMN functional activity conditional upon BRAIN genes. Dashed line indicates p = 0.05. f MAGMA gene-set analysis on HAR-BRAIN genes and other “NETMAT amplitude 25” phenotypes representing functional activity in the other functional networks (−log10-transformed adjusted p-values, FDR corrected). Colors indicate the assignment of functional networks, as in Fig. 2b. Dashed line indicates adjusted p = 0.05

