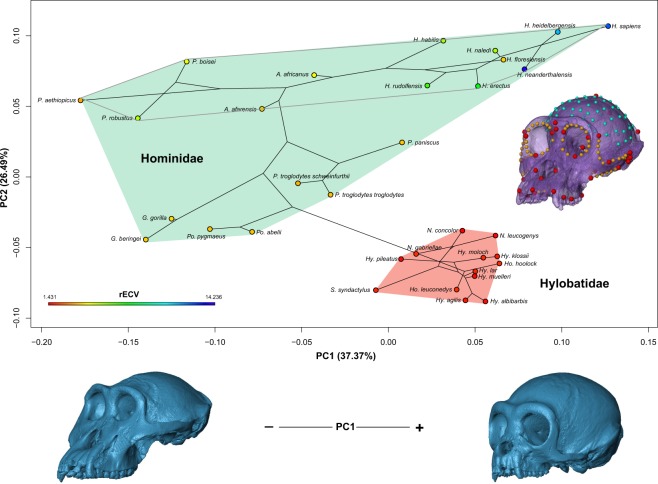
Figure 1.
Morphometric analyses of hominoid primate’s craniofacial shape. (Top) Ordination of 21 extant and 12 fossil hominoid species in the phylomorphospace determined by the first two principal components (PC1 and PC2) of craniofacial variation. Together, they account for ~63% of total variance. Subtribe Hominina clade is defined by the filled gray line. Cranium at mid-right shows the located landmarks (red), curves (yellow) and surface (cyan) semilandmarks on each individual. Each species endocranial volume relative to its cranial base centroid size (rECV) is defined by the color on each data point. The two hominoid families are indicated. (Bottom) Craniofacial shape changes correspondent to PC1. These were obtained by warping the minimum and maximum PC1 scores in R software (for a visualization of shape changes in PC2 see Fig. S1).

