
Figure 2.
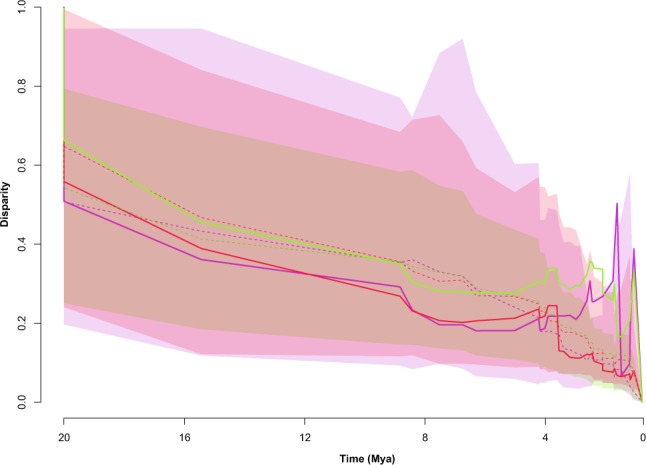
Disparity-through-time (DTT) plot using PC1-2 (red) and PC1-9 (green) scores, estimated from the hominoid species morphometric data, and rECV (purple). Average value at a given point in time is the average disparity of subclades whose ancestral lineages were present at that time relative to the disparity of the entire clade. Higher values of relative disparity correspond to greater variance values within subclades relative to the morphological disparity of the whole subclade. Dashed lines depict the mean of simulated disparity under a Brownian motion model. Shaded areas represent 95% confidence intervals of the simulated data.