
Figure 4.
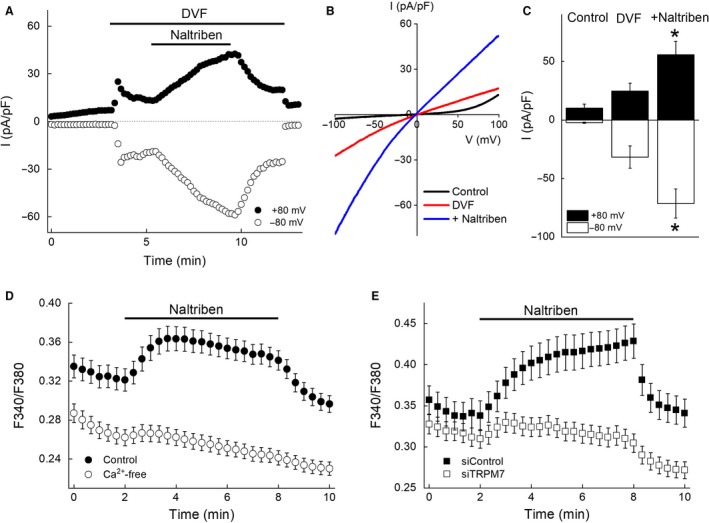
Effects of naltriben on TRPM7 current and [Ca2+]i in 3T3‐L1 adipocytes. (A) A representative trace of whole‐cell currents showing the time course of current activation by an application of DVF and augmentation by the addition of naltriben (50 μmol/L) in a differentiated 3T3‐L1 adipocyte in the presence of 29 μmol/L [Mg2+]i. The current amplitude at +80 mV (closed circles) or −80 mV (open circles) was plotted against the recording time. (B) Representative I–V relationship of TRPM7 current recorded from the same cell shown in A under the control (black line), DVF (red line), or 4 min after application of naltriben (50 μmol/L) (blue line). (C) Both inward and outward currents were augmented in 3T3‐L1 adipocytes. Each bar represents the mean ± SEM (vertical bar) of six observations. *P < 0.05 versus DVF. (D) Ratiometric Ca2+ imaging in 3T3‐L1 adipocytes. Naltriben (50 μmol/L) increased [Ca2+]i, as indicated by the fluorescence ratio (F340/F380), in the presence of 2 mmol/L [Ca2+]o, but not in the absence of extracellular Ca2+. Each symbol represents the mean ± SEM (vertical bar) of 66 or 104 observations, in control or Ca2+‐free conditions, respectively. (E) Naltriben (50 μmol/L) increased [Ca2+]i in siControl‐adipocytes (closed squares) but not in siTRPM7‐adipocytes (open squares). Each symbol represents the mean ± SEM (vertical bar) of 56 or 50 observations, in siControl‐adipocytes or siTRPM7‐adipocytes, respectively.