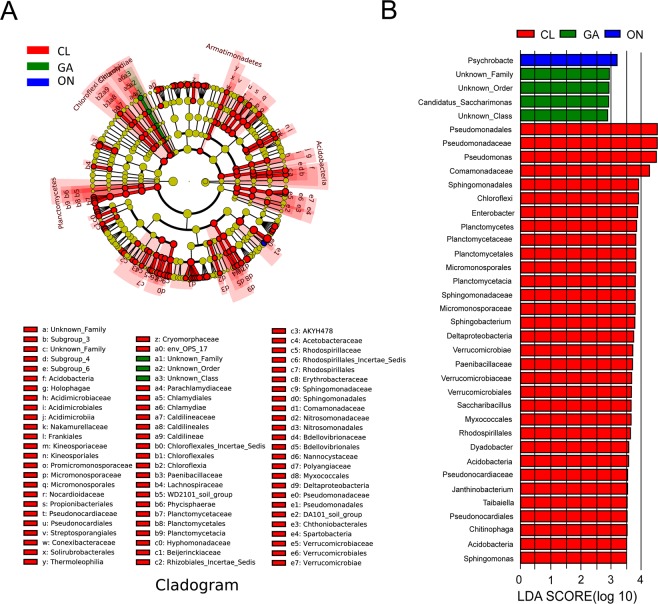
Figure 5.
Groups from the phylum-to-genus levels determined to be significant representatives of their sample group, based on LEfSe software analysis. (A) Cladogram representing the taxonomic hierarchical structure of the identified habitat biomarkers generated using LEfSe. Each ring represents a taxonomic level, with phylum, class, order, and family emanating from the center to the periphery. Each circle is a taxonomic unit in the dataset, with circles or nodes shown in color where the taxon represents a significantly more abundant group. (B) Identified biomarkers ranked by their effect size in different samples. The habitat biomarkers were identified as being significantly abundant (p < 0.05) when compared among samples. CL: Chinese leek; WO: Welsh onion; GA: Garlic; ON: onion.

