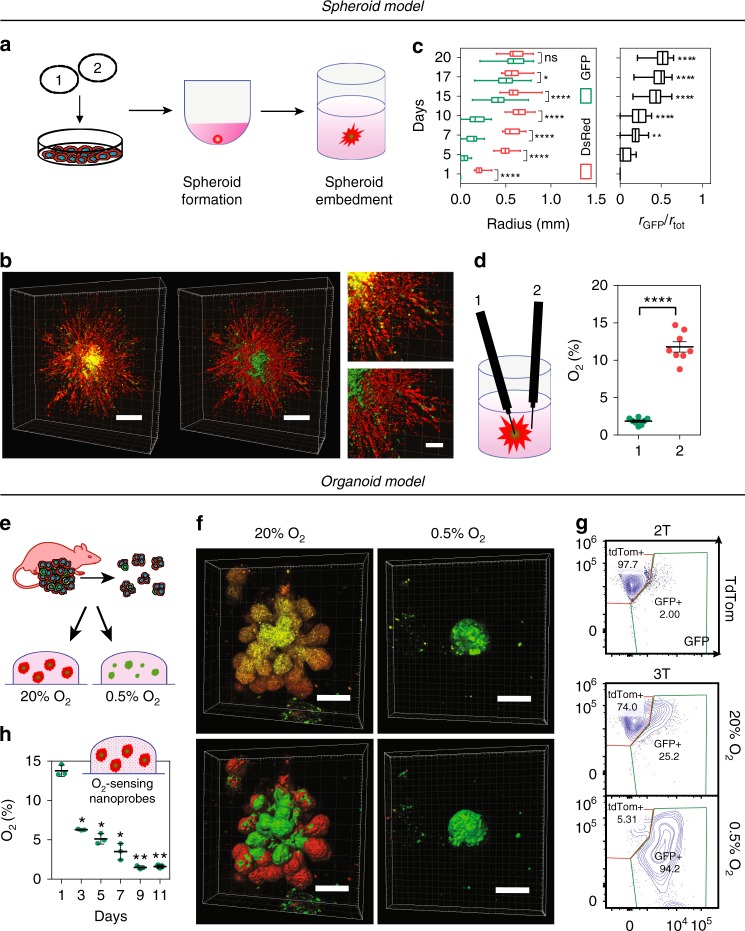
Fig. 3.
Fate mapping of hypoxic cells in 3D models. a Hypoxia fate-mapping cells were used to generate 3D spheroid cultures. Spheroids were formed in spheroid formation media in round-bottom well plates and transferred to the center of 3D collagen matrices 72 h later. b 3D reconstruction of a spheroid imaged after 15 days in culture and correspondent 3D surface rendering (right and bottom). Scale bar: 500 μm (left), 200 μm (right). c Analysis of color distribution measured along the spheroid radius (mean ± SEM, N = 3, n = 27); ****P < 0.0001 GFP versus DsRed on each day (Two-way ANOVA with Bonferroni posttest) (left). Length of the GFP+ radius (rGFP) over the total spheroid radius (rtot) (mean ± SEM, N = 3, n = 27); ****P < 0.0001 versus day 5 (one-way ANOVA with Bonferroni posttest) (right). The box extends from the 25th to 75th percentiles, the median is marked by the vertical line inside the box, and the whiskers represent the minimum and maximum points. d O2 measurements in the core (1) or periphery (2) of MDA-MB-231 spheroids following 20 days in culture under 20% O2 (mean ± SEM, N = 8); ****P < 0.0001 position 1 versus 2 (two-tailed t-test). e Organoids derived from 3 T mouse tumors were embedded in 3D in Matrigel and cultured under 20% or 0.5% O2. f 3D reconstruction of fluorescent images of organoids following 10 days of culture under 20% or 0.5% O2 with corresponding 3D surface rendering (bottom). Scale bar: 100 μm. g Representative contour plots of flow cytometry data from 3 T mouse tumor organoids cultured under 20% or 0.5% O2 for 20 days. 2 T tumor organoids were used to define tdTom+ and GFP+ gates for flow cytometry analysis (Supplementary Fig. 4d). h O2 measurements performed by using OXNANO nanoprobes dispersed in 3D Matrigel surrounding embedded organoids (mean ± SEM, N = 3, n > 200); ****P < 0.0001 versus day 1 (matched one-way ANOVA with Bonferroni posttest)

