Fig. 2.
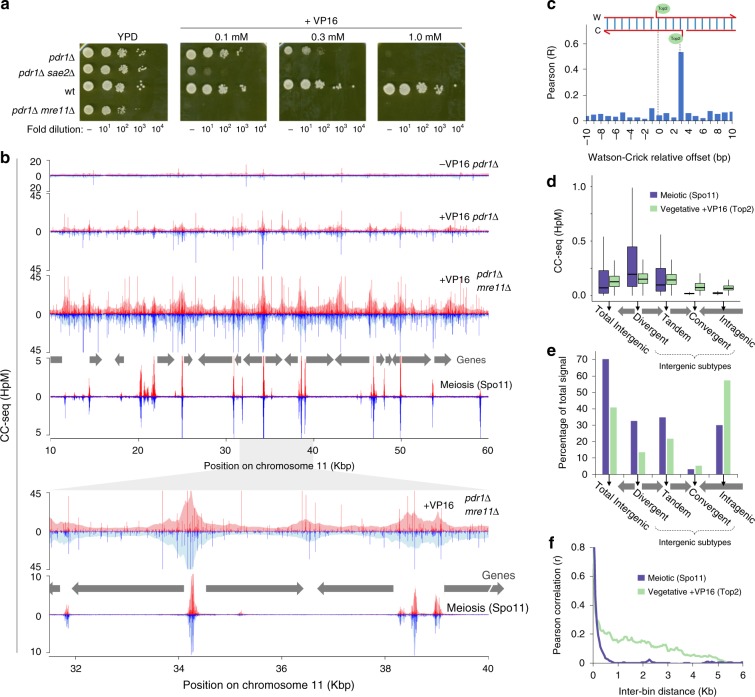
CC-seq maps covalent Top2-linked DNA breaks in vegetative S. cerevisiae with nucleotide accuracy. a Serial dilution spot tests of VP16 tolerance for the indicated strains. b Nucleotide resolution CC-seq maps of vegetative S. cerevisiae Top2 CCs in the indicated strains after 4 h treatment with 1 mM VP16. Spo11 CC-seq data is plotted for comparison. Top2 CC-seq data were calibrated using a human DNA spike-in. Red and blue traces indicate CC-linked 5′ DNA termini on the Watson and Crick strands, respectively. Grey arrows indicate positions of gene open reading frames. Lower panels show an expanded view of the region from 31.5 to 40 Kbp. Pale shaded areas are the same data smoothed according to local density. c Pearson correlation (r) of Top2 (pdr1∆) CC-seq signal on Watson and Crick strands, offset by the indicated distance. d Quantification of vegetative Top2 (pdr1∆) and meiotic Spo11 CC-seq signal, stratified by genomic region. The genome was divided into intra and intergenic regions; the latter further subdivided into divergent, tandem and convergent based on orientation of flanking genes. Spo11 and Top2 activity mapped by CC-seq is expressed as box-and-whisker plots of density (upper and lower box limit: third and first quartile; bar: median; upper and lower whisker: highest and lowest values within 1.5-fold of the interquartile range). Wilcox p-values < 10−3. e Aggregation of data shown in (c), expressed as the percentage of total mapped reads. f Local autocorrelation of Top2 (pdr1∆) or Spo11 CC-seq signals. Top2 or Spo11 CC-seq data were binned at 50 bp resolution and the Pearson correlation (r) calculated between bins of increasing separation. HpM Hits per million mapped reads per base pair

