Fig. 3.
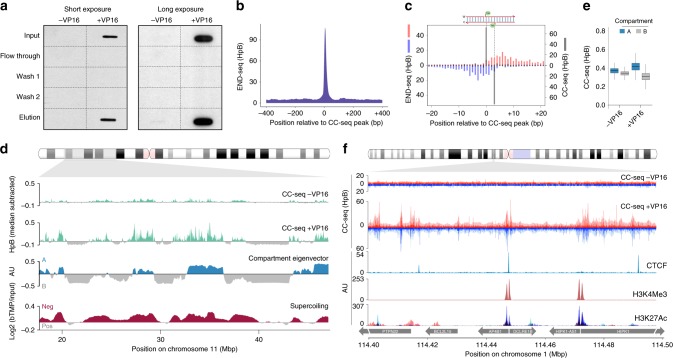
CC-seq maps TOP2-linked DNA breaks in human cells with nucleotide accuracy. a Anti-TOP2β western slot blot of input, flow through, wash, and elution fractions. RPE-1 cells were treated or not with 100 µM VP16, prior to processing according to Fig. 1a. b Medium-scale aggregate of END-seq mapped DSBs18 surrounding nucleotide resolution CC-seq mapped TOP2 CCs. c Fine-scale strand-specific aggregate of END-seq mapped DSB ends (red and blue bars) and nucleotide resolution CC-seq mapped TOP2 CCs (grey bars) surrounding strong TOP2 CC sites. d Broad-scale CC-seq maps of TOP2 CCs produced in human RPE-1 cells ± VP16. Raw data were scaled, binned, smoothed and median subtracted prior to plotting. Chromatin compartments revealed by Hi-C eigenvector analysis47, and supercoiling revealed by bTMP ChIP-seq44 are shown for comparison. e Quantification of TOP2 CCs in chromatin compartments A and B. Data are expressed as box-and-whisker plots of density as for Fig. 2d. f Fine-scale CC-seq maps of TOP2 CCs produced in human RPE-1 cells ± VP16. Red and blue traces indicate TOP2-linked 5′ DNA termini on the Watson and Crick strands, respectively. Data in pale shaded areas has been smoothed according to local density. RPE-1 CTCF and H3K4Me3 ChIP-seq data plus H3K27Ac ChIP-seq data overlaid from seven cell lines71 is shown for comparison. HpM, HpB Hits per million (or billion) mapped reads per base pair. Source data are provided as a Source Data file

