Fig. 4.
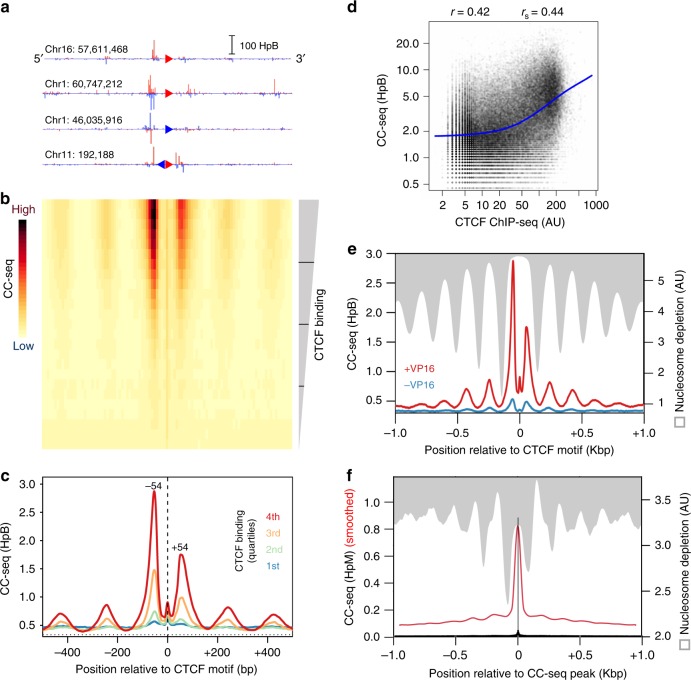
CTCF-proximal TOP2 activity is tightly confined within nucleosome-depleted regions. a–c Aggregation of TOP2 CCs in a 1 Kbp window centred on orientated CTCF motifs in human RPE-1 cells. Four example CTCF loci are shown orientated in the 5′-3′ direction. Red and blue triangles indicate Watson and Crick CTCF motifs, respectively (a). A heatmap of all CTCF-motifs in the human genome, with 25 aggregated rows stratified by the strength of colocalising CTCF ChIP-seq peaks in RPE-1 cells. The colour scale indicates average TOP2 CC density in each 10 bp bin (b). Motifs are also stratified into quartiles of CTCF-binding, and the average TOP2 CC distribution in each quartile plotted. Horizontal line is the genome mean. Vertical line is the TSS (c). d Quantitative relationship between CC-seq (±100 bp) and CTCF ChIP-seq signal centred on CTCF motifs. Blue line = lowess curve. Pearson r and Spearman rs values were calculated between CC-seq and log-transformed CTCF ChIP-seq. e Aggregated TOP2 CC distribution (red line) in the highest quartile of CTCF-binding compared with the average MNase-seq signal71 (grey). f Aggregated TOP2 CC distribution (black and red lines: single-nucleotide resolution and smoothed, respectively) and the average MNase-seq signal (grey) surrounding strong TOP2 CC sites. MNase-seq data in (e–f) is inverted to emphasise spatial relationship between CC-seq and nucleosome depletion (white). HpM, HpB Hits per million (or billion) mapped reads per base pair

