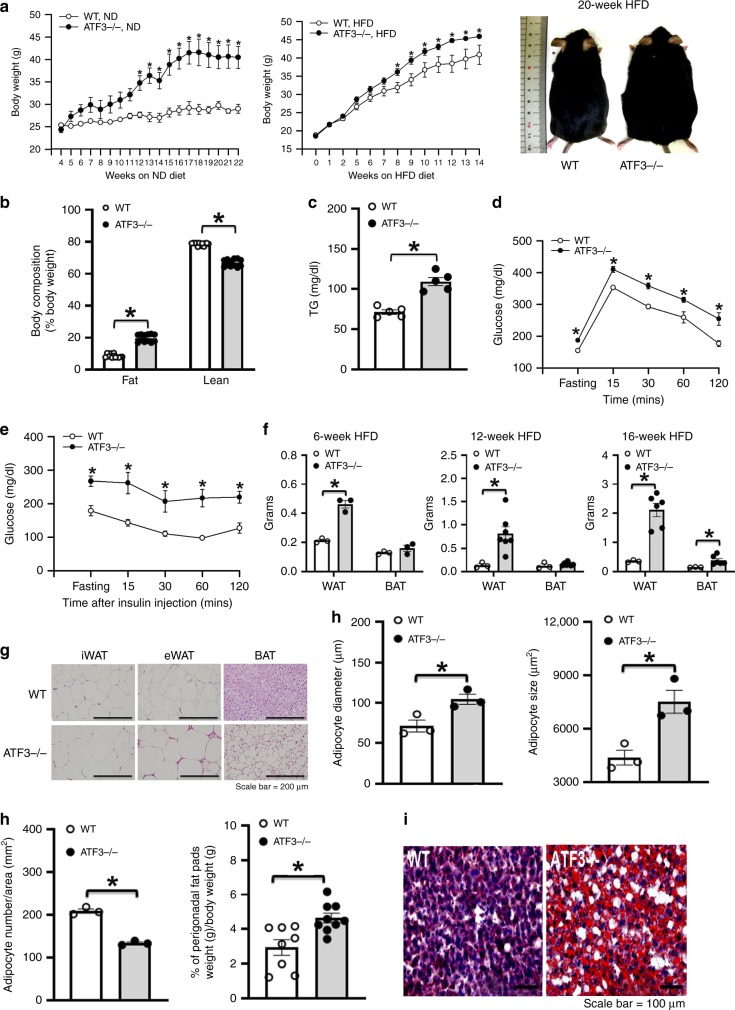
Fig. 2.
Loss of ATF3 in mice aggravated high fat diet (HFD)-induced obesity and metabolic dysfunction. ATF3 gene-deleted mice (ATF3−/−) and their wild-type littermates (WT) fed a normal diet (ND) or a HFD for 22 or 14 weeks, respectively. Measurement was performed after 12 weeks of HFD feeding for both groups. a Body weight of wild-type (WT) and ATF3−/− mice fed a normal diet (ND) or HFD and body image. b Body composition of wild-type and ATF3−/− mice. Proportion of body fat and lean mass as a percentage of their respective body weights. c Serum triglycerides (TG) level. d Glucose tolerance test. e Insulin tolerance test. f White adipose tissue (WAT) and brown adipose tissue (BAT) fat-pad weights. g Representative H&E staining of inguinal WAT (iWAT), epididymal WAT (eWAT), and BAT. h Adipocyte diameter (µm), size (μm2), number per area (mm2), and perigonadal fat pad weight per body weight (g). i Oil-red O staining in liver. For a, n = 3 per group (ND); wild-type, HFD (n = 4), ATF3−/−, HFD (n = 9). For b, n = 12 per group. For c, n = 5 per group. For d, wild-type (n = 4), ATF3−/− (n = 5). For e, n = 3 per group. For f, wild-type (n = 3), ATF3−/− (n = 3 in 6-week HFD; n = 7 in 12-week HFD; n = 6 in 16-week HFD). For g–i, n = 3 per group, except wild-type (n = 8), ATF3−/− (n = 9) in % of perigonadal fat pads weight/body weight. Scale bar for images g: 200 µm; i: 100 µm. Data are mean ± SEM. and *p < 0.05 compared to wild-type

