Fig. 5.
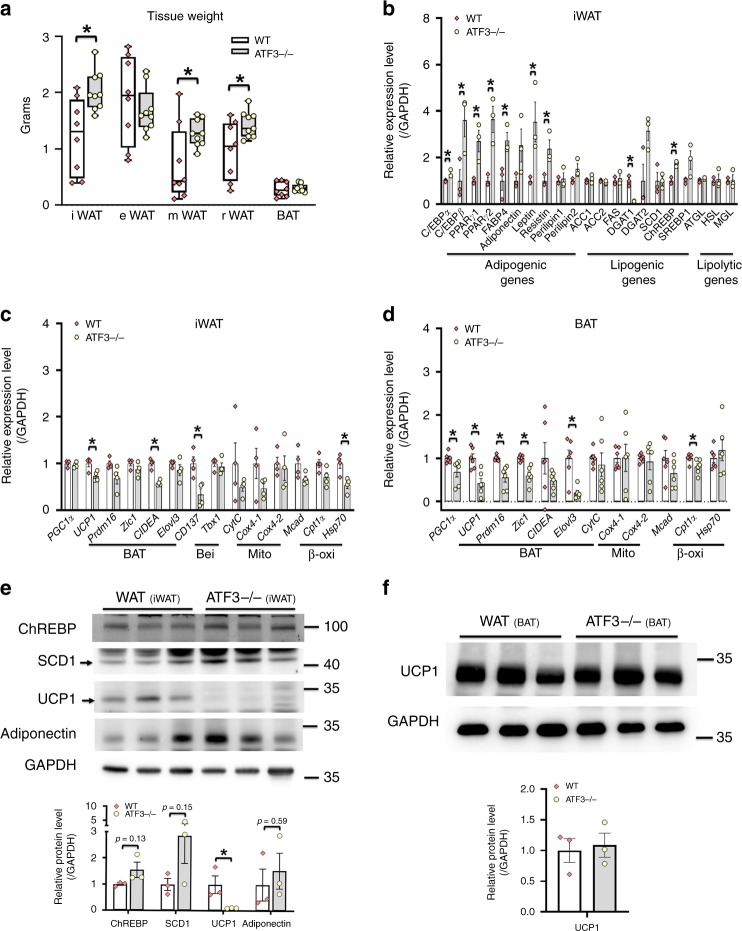
ATF3−/− mice showed dysregulated WAT/BAT balance. Analysis of ATF3−/− and wild-type mice after 12 weeks of HFD feeding. a Weights of brown adipose tissue (BAT) and white adipose tissue (WAT) in individual depots including inguinal WAT (iWAT), epididymal WAT (eWAT), mesenteric WAT (mWAT), and retroperitoneal WAT (rWAT) fat pads. b Analysis of gene expression of adipogenic, lipogenic, and lipolytic genes in iWAT. c Analysis of gene expression of brown (BAT), beige (Bei), mitochondria (Mito), and β-oxidation (β-oxi) markers in iWAT. d Analysis of expression of brown/mitochondria/β-oxidation markers in BAT. e Protein levels of ChREBP, SCD1, UCP1 and adiponectin in iWAT. f Protein level of UCP1 in BAT. For a, wild-type (n = 8), ATF3−/− (n = 9). For b, n = 3 per group. For c, n = 4 per group. For d, n = 6 per group. For e, f, n = 3 per group. Data are mean ± SEM; *p < 0.05 compared to wild-type

