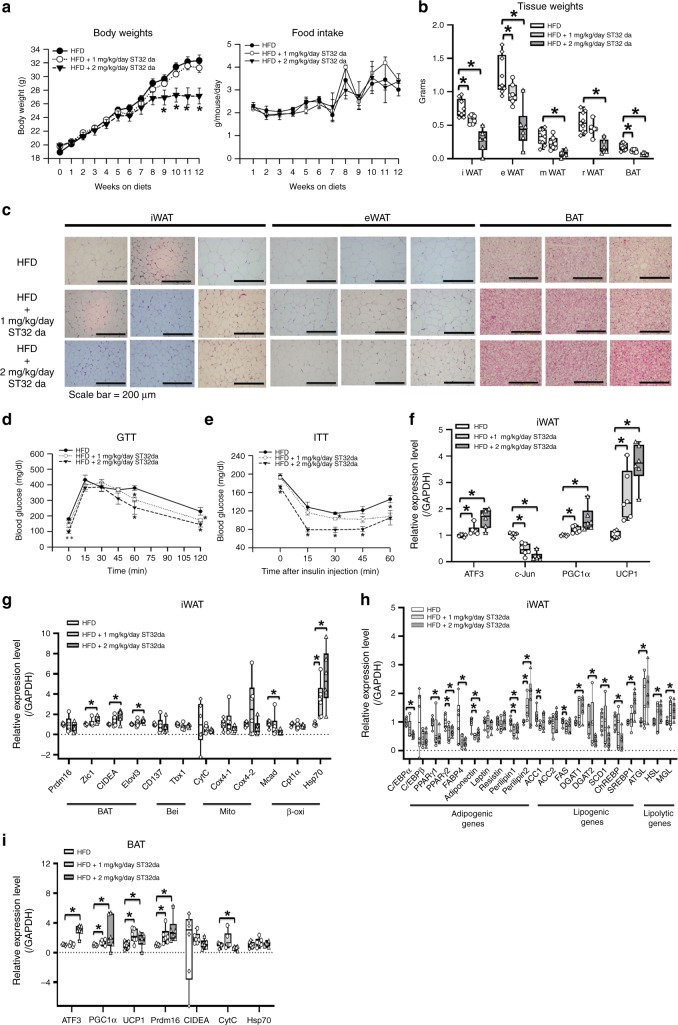
Fig. 9.
ATF3 inducer, ST32da, protects against HFD-induced obesity and metabolic dysfunction by promoting browning in vivo. Analysis of wild-type mice fed a HFD for 12 weeks with or without i.p. ST32da 1 or 2 mg kg−1 per day. a Body weight and food intake. b Change in adipose tissue depot weight in BAT and WAT. c H&E staining of inguinal WAT, epididymal WAT, and BAT fat depots. d Glucose tolerance test (GTT). e Insulin tolerance test (ITT). f Real-time PCR analysis of mRNA levels of ATF3, c-Jun, PGC-1α and UCP1. g Real-time PCR analysis of mRNA levels of brown (BAT) and beige (Bei), mitochondria (Mito), and β-oxidation (β-oxi) genes in iWAT; h adipogenic, lipogenic, and lipolytic genes in iWAT; and i brown fat programs in BAT. For a, HFD (n = 10), HFD + 1 mg kg−1 per day ST32da (n = 8), HFD + 2 mg kg−1 per day ST32da (n = 8). For b, HFD (n = 9), HFD + 1 mg kg−1 per day ST32da (n = 7), HFD + 2 mg kg−1 per day ST32da (n = 6). For c, n = 3 per group. For d, e, HFD (n = 4), HFD + 1 mg kg−1 per day ST32da (n = 5), HFD + 2 mg kg−1 per day ST32da (n = 4). For f, g, n = 6 per group. For h, HFD (n = 6), HFD + 1 mg kg−1 per day ST32da (n = 5), HFD + 2 mg kg−1 per day ST32da (n = 6). For i, n = 6 per group. Data are mean ± SEM; *p < 0.05 compared to HFD group

