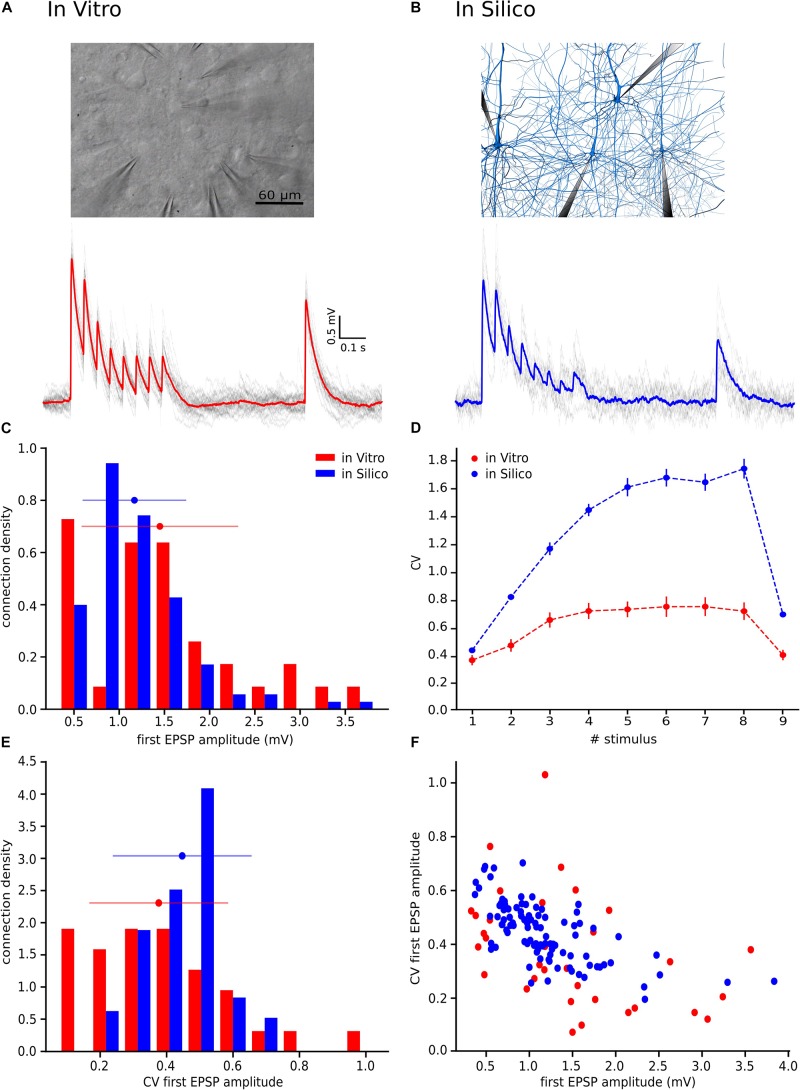
FIGURE 1.
With the UVR hypothesis it was not possible to reproduce the variability observed in vitro. (A) Example of a multiple whole cell patch-clamp recording in L5_TTPC connections (top). In vitro mean voltage trace (bottom; red) of 20 protocol repetitions (gray). (B) Illustration of an in silico patch-clamp experiment performed on L5_TTPC connections from the data-driven model of the rat cortex microcolumn. In silico mean voltage trace (bottom; blue) of 20 protocol repetitions (gray). (C) Histogram showing the distribution of the first EPSP amplitude for in vitro (red) and for in silico (blue) experiments. (D) Mean CV profiles for the in vitro (red) and the in silico (blue) experiments. (E) CV distribution of the first EPSP amplitude for in vitro (red) and in silico (blue) data sets. (F) Raster plot of the first EPSP amplitude against the CV of the first EPSP amplitude for in vitro (red) and in silico (blue) experiments. In the distributions and the CV profile, dots represent the mean and vertical and horizontal bars represent the standard deviation of all the experiments respectively.

