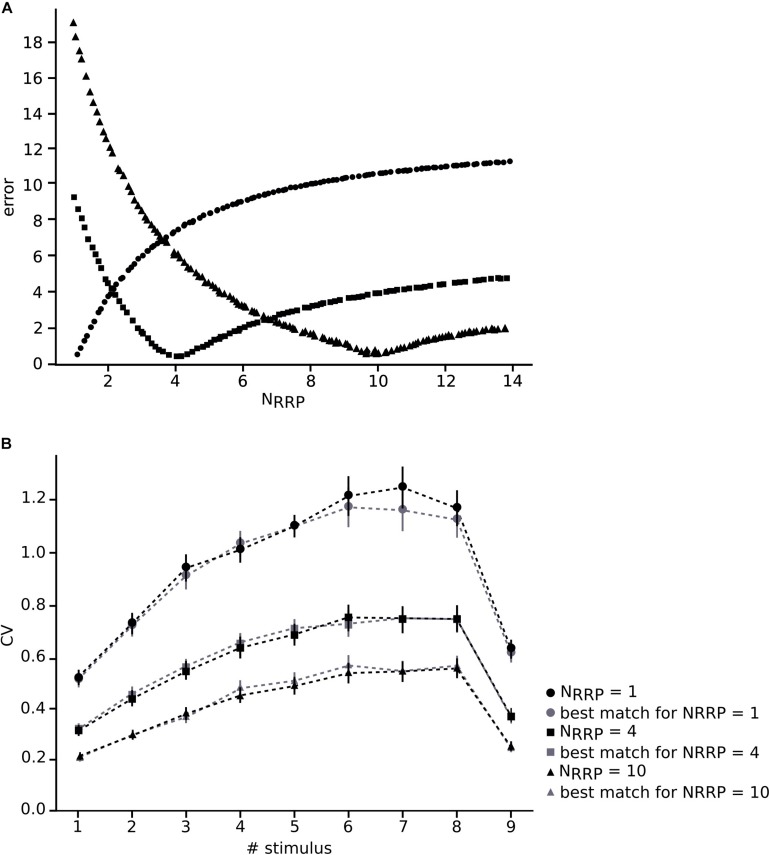
FIGURE 2.
Validating the method. (A) Varying NRRP against error for the different in silico data sets around the appropriate corresponding NRRP (dots, NRRP = 1; squares, NRRP = 4; triangles, NRRP = 10). (B) Mean CV profiles of the three different in silico data sets (black) and the simulations (gray). Dots, squares and triangles represent the mean while the error bars show the standard deviation.

