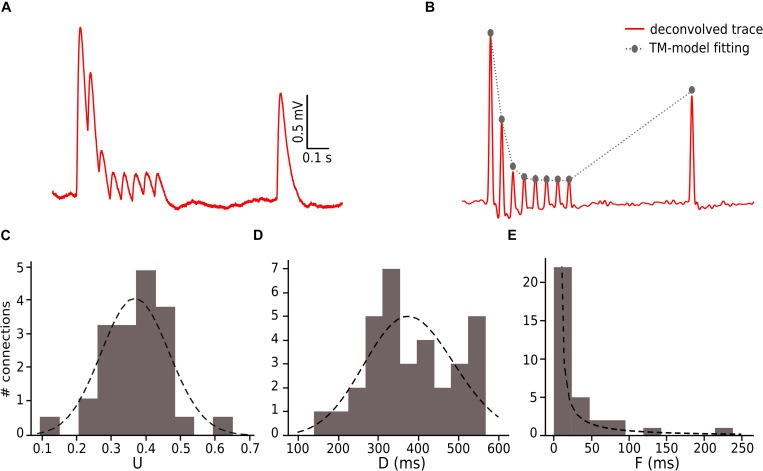
FIGURE 3.
Fitting in vitro data to the TM-model. (A) Example of an in vitro mean voltage trace of L5_TTPC connection. (B) Corresponding deconvolved voltage trace (red) with the fit to the deterministic TM-model (gray). (C) Distribution of the probability of release parameter (U), (D) distribution of the time to recovery from depression (D) and (E) distribution of the time to recovery from facilitation (F). Values obtained from the fitting to the TM-model of 33 in vitro connections.

