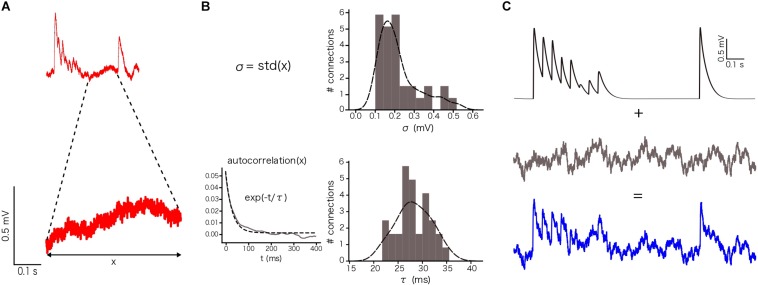
FIGURE 4.
Noise calibration. (A) Example of an in vitro single protocol repetition (top). Zoom over 400 ms segment used to compute the parameters for noise calibration (bottom). (B) Distribution of σ (up) and τ (bottom). σ was computed as the standard deviation of the voltage segment. τ was computed by fitting the voltage segment autocorrelation to an exponential. The distributions show the mean values for the 33 in vitro connections. (C) (up) Single in silico trace without noise, (middle) OU-process generated to be added to the single in silico trace and (bottom) the noisy single protocol repetition that is the result of adding the previous two traces.

