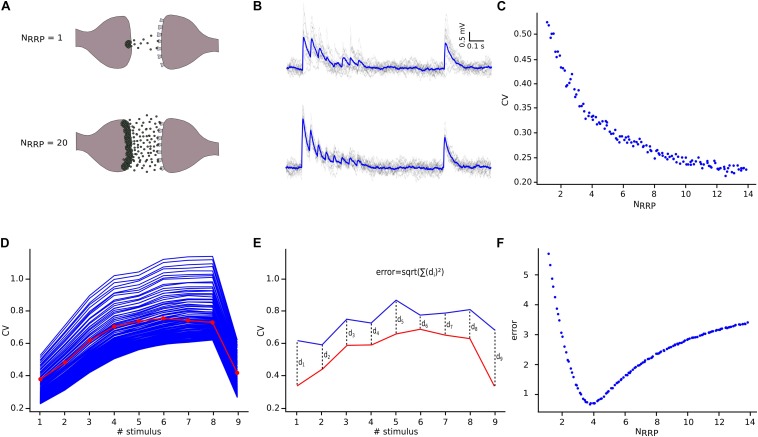
FIGURE 5.
NRRP computation. (A) Illustration showing one synaptic connection releasing neuro transmitters from only one vesicle (top) and the same synaptic connection releasing neurotransmitters from twenty vesicles (bottom). (B) The corresponding effect of releasing neurotransmitters from one (top) or from twenty (bottom) vesicles reflected on the variability and shape of the in silico traces. The mean voltage traces are painted in blue while each protocol repetition is represented in gray. (C) Diagram showing the effect of NRRP over the CV. (D) Mean CV profile for the in vitro (red) and all the in silico connections with different NRRP values. (E) Diagram explaining the mean square distance computation. (F) NRRP against error, showed a clear minimum around the value obtained for this specific connection.

