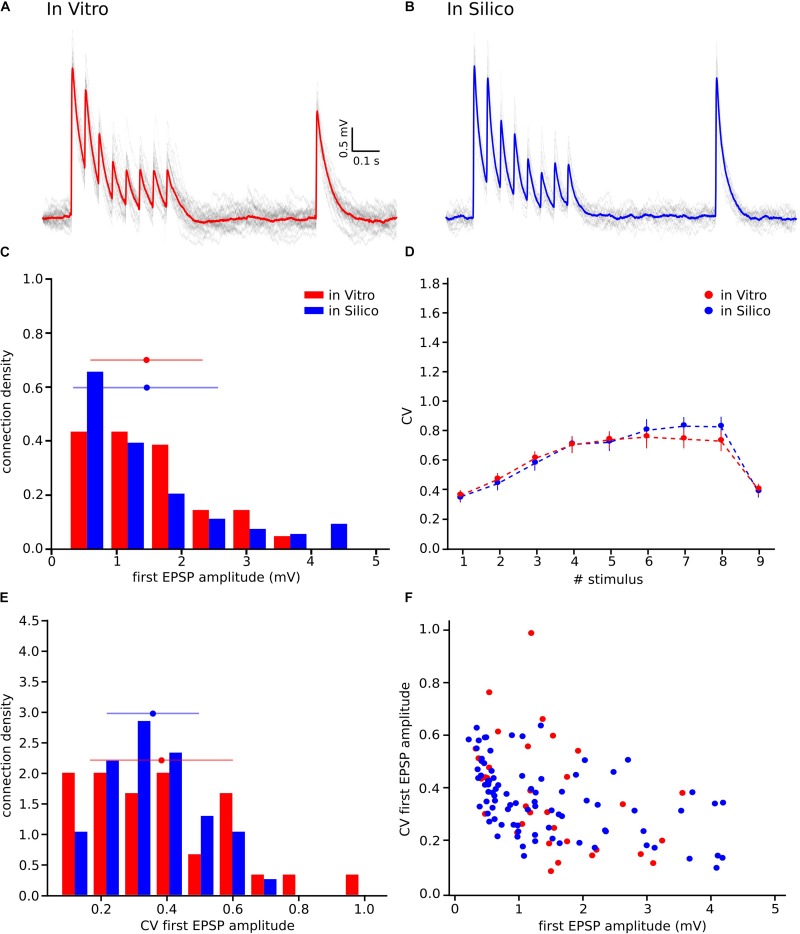
FIGURE 6.
Releasing multiple vesicles improved the variability of the model. (A) In vitro mean voltage trace (red) of 20 protocol repetitions (gray) (same as in Figure 1A). (B) In silico mean voltage trace (blue) of 20 protocol repetitions (gray). (C) Distribution of the first EPSP amplitude for in vitro (red) and for the in silico (blue) experiments. (D) Mean CV profiles for the in vitro (red) and the in silico (blue) experiments. (E) CV Distribution of the first EPSP amplitude for in vitro (red) and the in silico (blue) data sets. (F) Raster plot of the first EPSP amplitude against the CV of the first EPSP amplitude for in vitro (red) and in silico (blue) experiments. All the in silico experiments are done with the NRRP value that produces the minimum error. In the distributions and the CV profile, dots represent the mean and vertical and horizontal bars represent the standard deviation of all the experiments.

