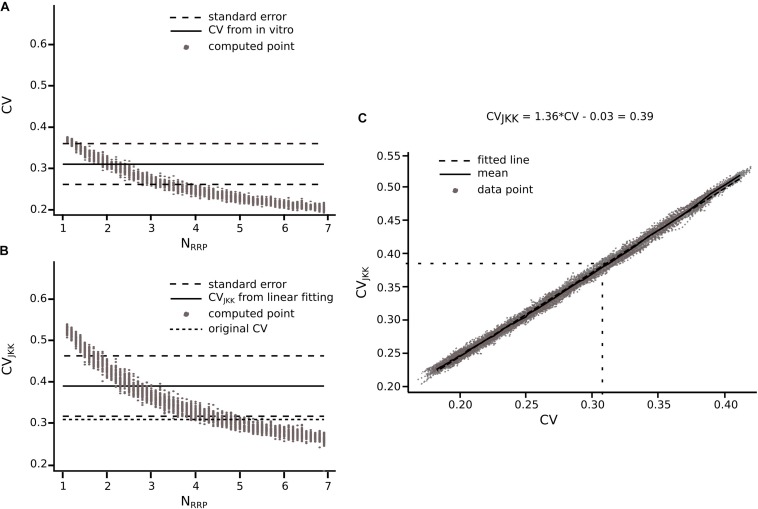
FIGURE 7.
Extension of the method for connections reported in literature. Transformation from CV to CVJKK using L5_TTPC connection as example (A) CV computed for different NRRP. Solid black line represents the CV computed for the in vitro data. Dotted black lines represent the standard error of the CV. (B) CVJKK computed for different NRRP. Solid black line represents the CVJKK obtained from the lineal fitting on C. Dotted black lines represent the standard error for this CVJKK. Short dotted black line represents the original CV found in literature. (C) CV to CVJKK transformation. Solid black line represents the mean of the 50 iterations and dotted black line represent the linear fitting which equation is at the top of the plot. In (A,B) the gray dots show the 50 iterations from which we extract the best NRRP as the one corresponding with the closest CV.

