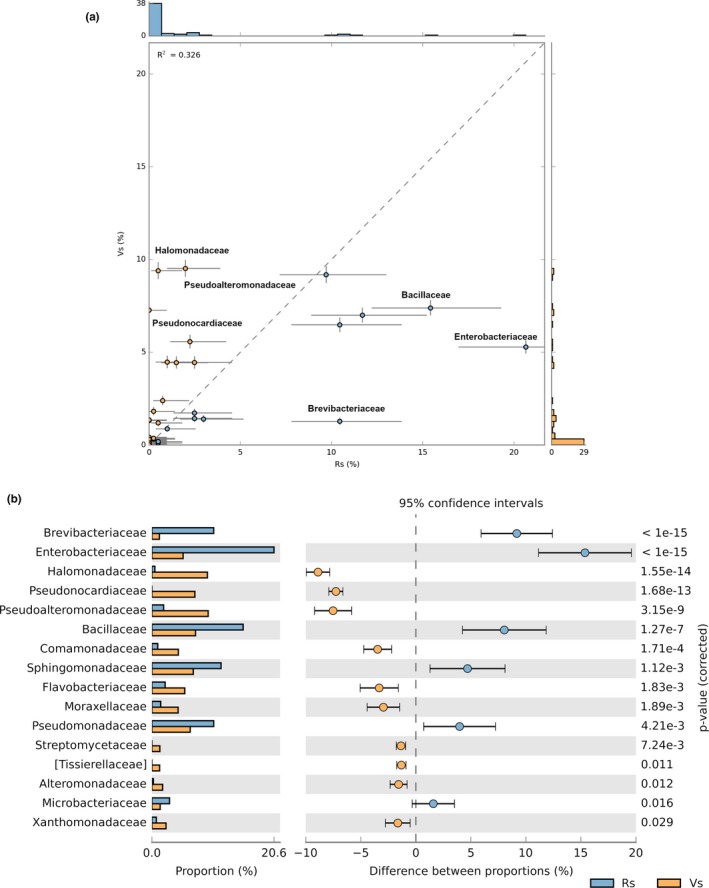
Figure A1.

Comparison of taxonomic profiles between bacterial communities of vegetative and reproductive stages. (a) Scatter plot graph showing differences at the family level, (b) extended error bar percentage representation plot is showing differences in abundance between central bacterial populations at family level.
