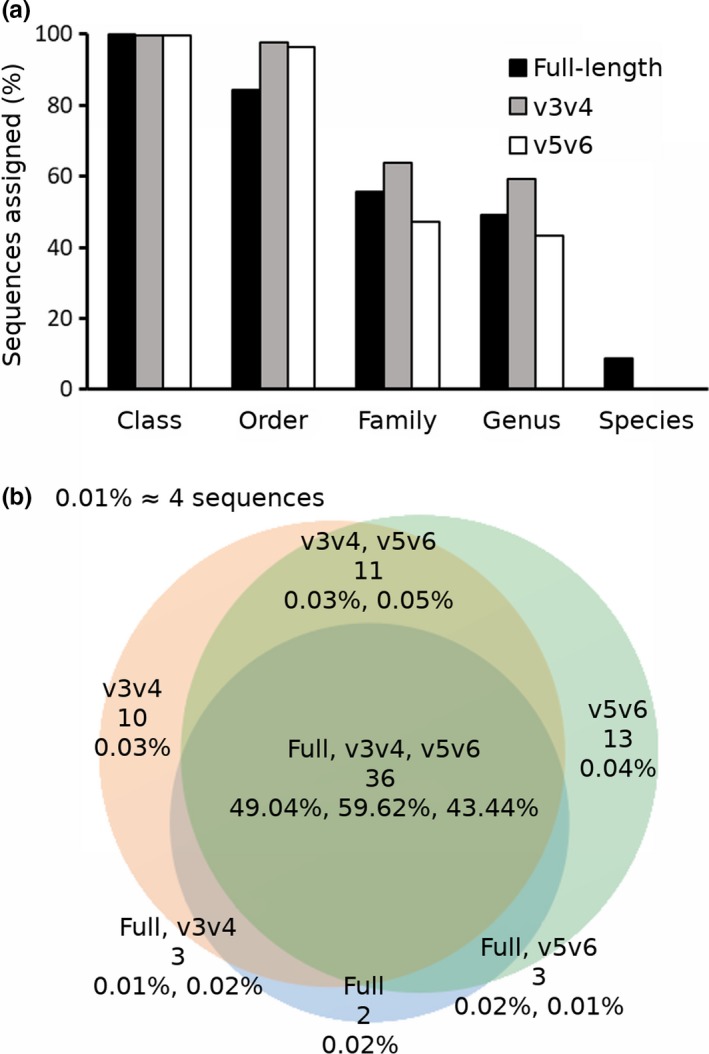
Figure 3.

Percentage of assigned sequences at the class, order, family, genus, and species levels from full‐length (black bars), v3v4 (gray bars), and v5v6 (white bars) datasets (a). Venn diagram of genus level assignments illustrating the number of taxa shared in and between each dataset (b). Top line shows dataset(s), middle line shows the number of unique genus taxa shared among dataset(s), bottom line shows the relative abundance of sequences assigned to the involved taxa and the given dataset(s)
