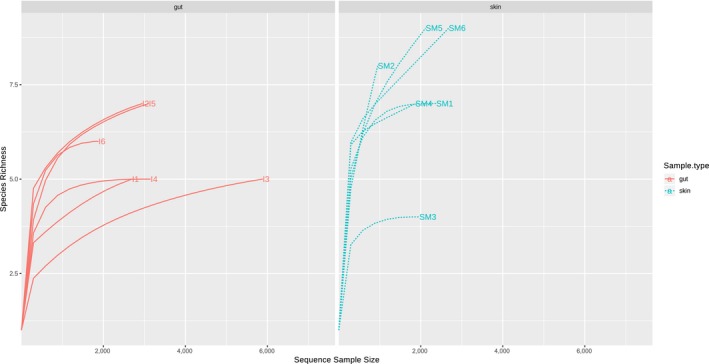
Figure A2.

Rarefaction plots based on OTU analysis for intestine and skin samples. Underlaying data represent the number of sequences in each dataset mapped to OTUs clustered with a 97% identity threshold. Plot was generated using total sum scaling of filtered data showing 20 steps
