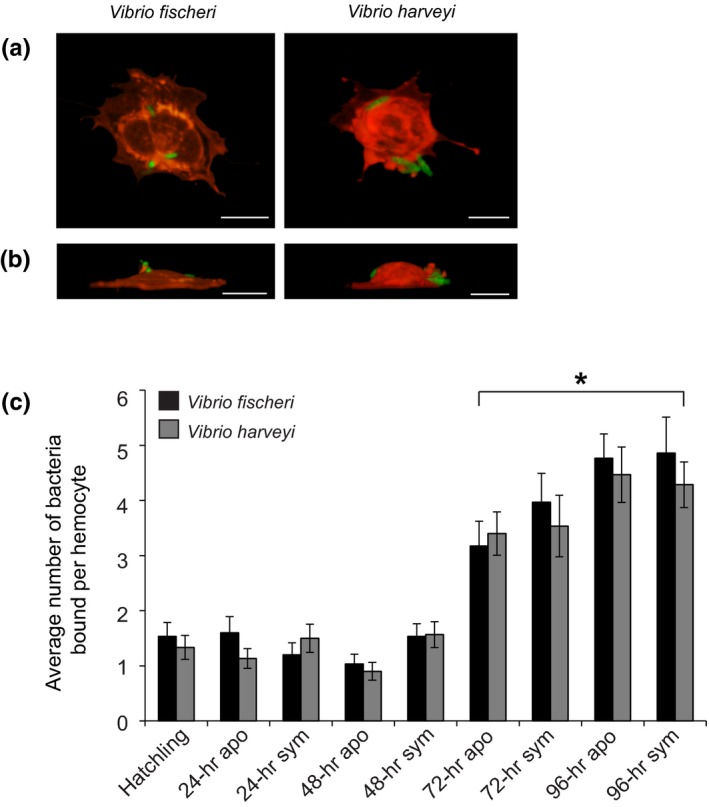
Figure 2.

Binding of Vibrio fischeri and Vibrio harveyi to juvenile hemocytes. (a, b) Representative 3D confocal images of bacteria bound to juvenile hemocytes were constructed from confocal Z‐series showing GFP‐expressing V. fischeri or V. harveyi (green) and hemocyte counterstaining with Con A (red), scale, 10 µm. (a) Top view of 3‐D images. (b) Side view of 3D images, with the adherent side of the hemocytes at the bottom of the images. (c) The average number of bacteria bound per hemocyte. Bars represent the average (±SE) of three biological repeats of 10 hemocytes chosen randomly from 10 different microscopic fields from a preparation of isolated hemocytes from 10 pooled animals (n = 4). *Time points that were statistically significantly different than the 0‐hr time point (ordinary least squares regression, p < 0.001)
