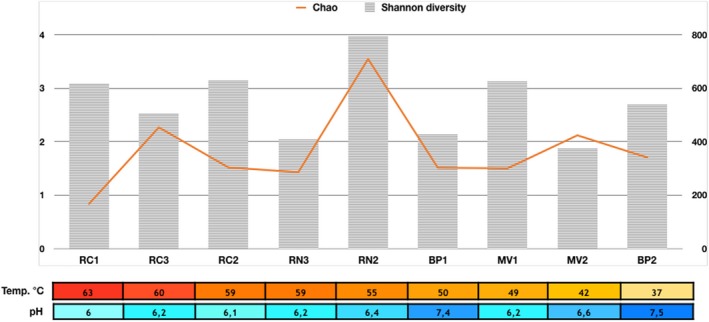
Figure 3.

Shannon's diversity index (H′) and Chao index of richness based on 16S rRNA gene amplicon pyrosequencing. Samples have been sorted by temperature, and pH values are also shown. Left axis shows Shannon diversity values and right axis Chao richness. Río Negro (RN), Miravalles (MV), Bajo las Peñas (BP), and Rocas Calientes (RC)
