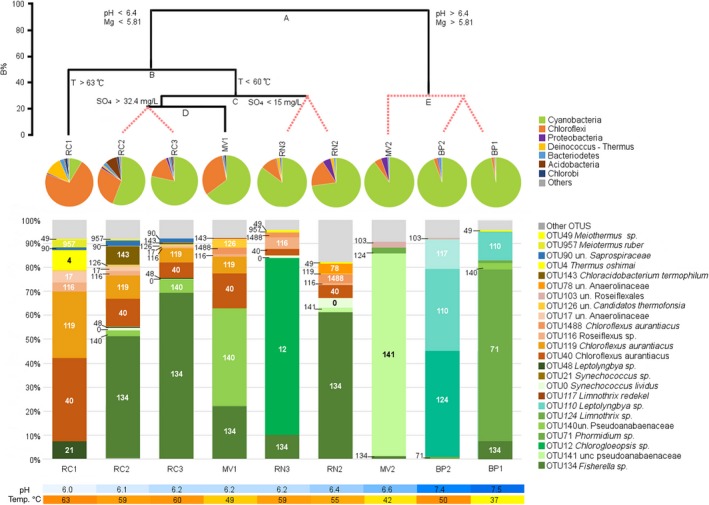
Figure 4.

A) Linkage tree analysis (LINKTREE) showing clustering of samples based on the distribution of the 24 most abundant OTUs and environmental variables. Statistically different groups shown by black lines. Red discontinuous lines show nonsignificantly different samples. Note that the split A separates the samples with higher pH and Mg2+ levels, and then B isolates RC1 with the highest spring temperature from the rest of the samples. See text for further details on C and D splits. B%: Bray‐Curtis similarity. B) Major phyla identified in the mats. Only phyla with mean relative abundance greater than 0.01% are shown. The “other” category comprises phyla Armatimonadetes, Planctomycetes, Spirochaetes, Saccharibacteria, and Firmicutes. C) Bar chart showing the 24 most abundant OTUs and their respective abundance in each sample. D) Color scales showing the different pH and temperatures (°C) in each sample
