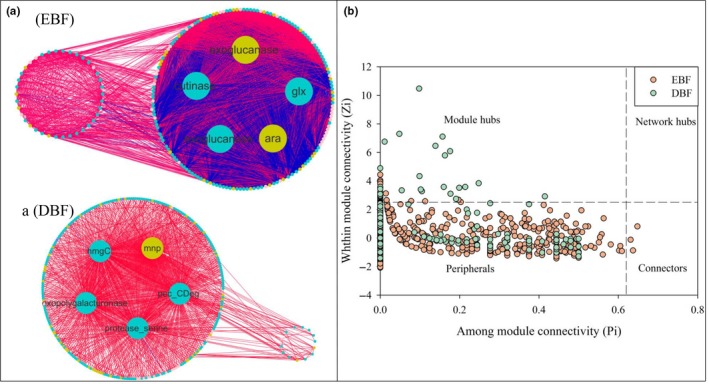
Figure 4.

The submodules of functional molecular ecological networks related to C degradation genes. (a) The first five nodes with high connectivity and their neighbors at evergreen broad‐leaved forest (EBF) and deciduous broad‐leaved forest (DBF). Edges between each pair of nodes represent different interactions, where edges in blue indicate positive interactions and edges in red indicate negative interactions. (b) Z‐P plot presenting the four roles of genes defined in terms of their values among module connectivity (Pi) and within module connectivity (Zi), Z‐P plot was drawn by carbon degradation functional genes, dots represent selected genes of evergreen broad‐leaved forest (in orange) and deciduous broad‐leaved forest (in green)
