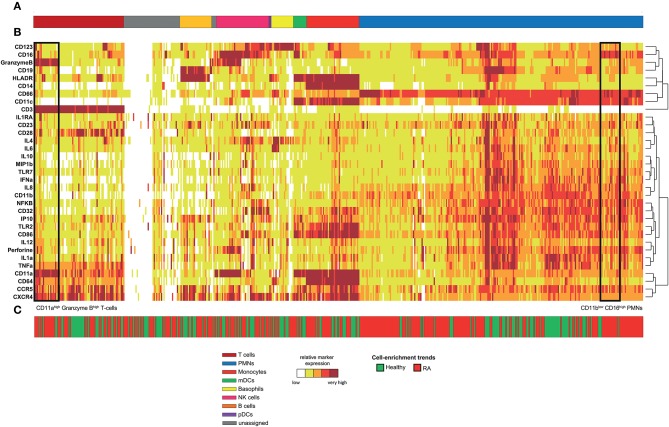
Figure 1.
Phenotypic diversity of leukocytes in RA disease. Whole blood was collected from nine RA-treated patients and five healthy donors. Following red blood cell lysis, leukocytes of each sample were stained using a mass cytometry panel consisting of 33 markers. A SPADE analysis was performed to identify 500 cell clusters. A categorical heatmap, representing the relative marker expression for each cluster, was generated. Marker expression ranges were calculated based on the 5th and 95th percentile of the expression of each marker. Then, ranges were divided into five uniform categories. The categorization of marker expression was computed based on the means of the cell cluster expression medians of each marker. These categories represent negative, low, medium, high, and bright relative marker expression using a color scale ranging from white to dark red. Hierarchical clustering was performed to gather clusters with similar phenotypes. Two additional hierarchical clusterings, one for clustering markers and the other for non-clustering markers, were performed to visualize markers with similar co-expression patterns. (A) Cell clusters were manually annotated based on the expression of specific cell markers and are represented by different colors. (B) Representation of the heatmap. (C) Chart showing the cell-enrichment trend toward an RA or healthy profile for each cluster.

