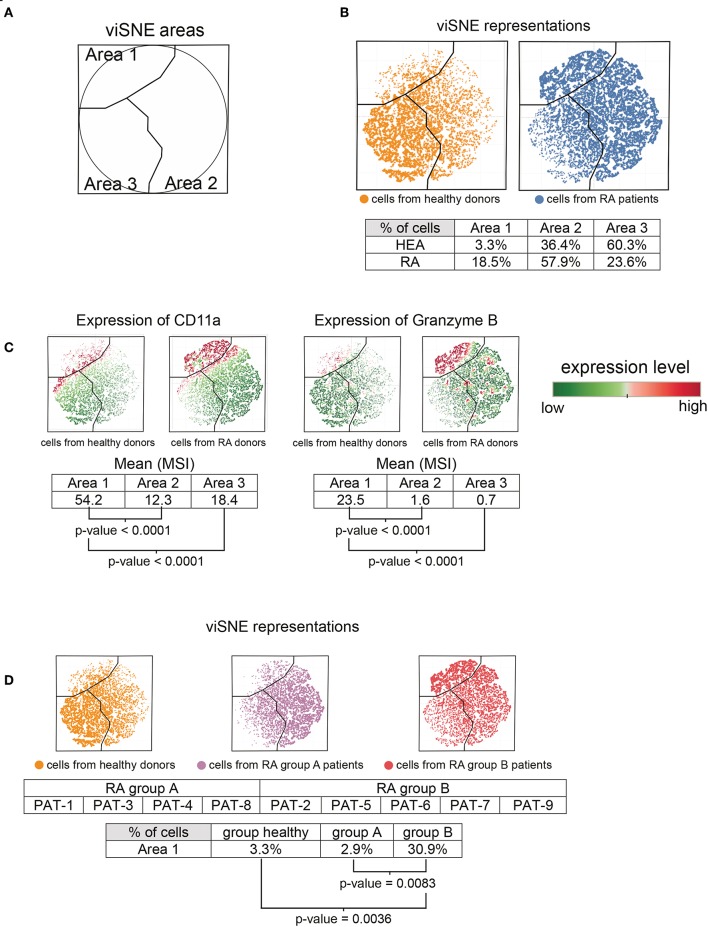
Figure 3.
Characterization of CD11ahigh Granzyme Bhigh T-cell subpopulation. All cells contained in T-cell clusters from SPADE analysis were computationally isolated and represented using viSNE, based on the expression of CD11a, CCR5, and Granzyme B. (A) viSNE representation showing three phenotypic areas delineated according to the localization of cells from RA patients (Areas 1 and 2) and healthy donors (Area 3). (B) viSNE maps representing the distribution of T-cells according to their expression of CD11a, CCR5, and Granzyme B. (C) viSNE maps representing the levels of CD11a and Granzyme B expressed by T-cells. (D) RA-patients were split into two groups, called group A and group B. viSNE maps representing the distribution of T-cells, according to their expression of CD11a, CCR5, and Granzyme B, for healthy donors and each group of RA patients.

