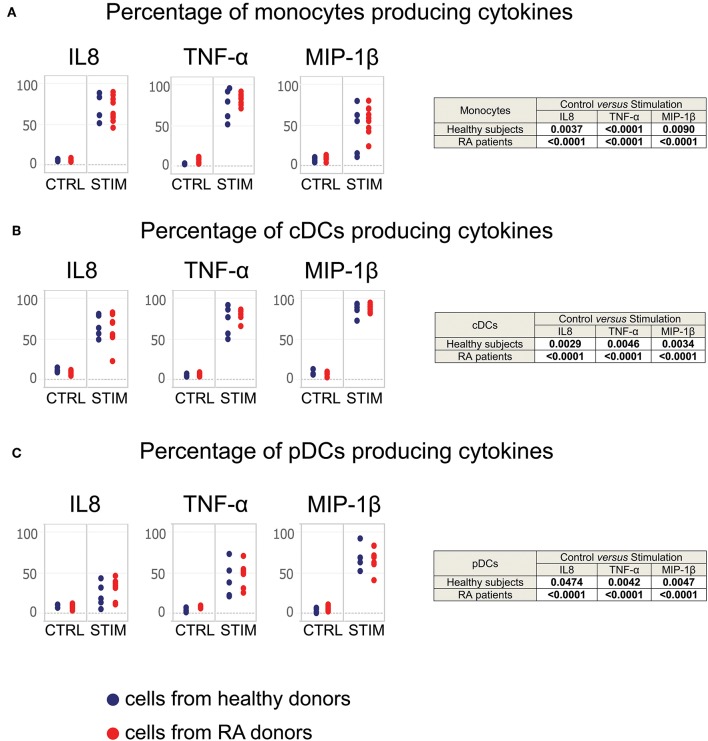
Figure 4.
Monocytes, cDCs, and pDCs from RA patients respond normally to TLR stimulation. Whole blood cells from healthy donors and RA patients were stimulated for 2 h with a mixture of TLR ligands. Controls were performed using PBS. The staining of cytokines was performed intracellularly. Monocyte, cDC, and pDC populations were exported from the SPADE analysis represented in Supplementary Figure 1. The percentage of (A) monocytes, (B) cDCs, and (C) pDCs producing MIP-1β, TNF-α, and IL-8 after stimulation are presented. Blue points correspond to the percentages of cells obtained from healthy subjects, red points to those from RA patients.

