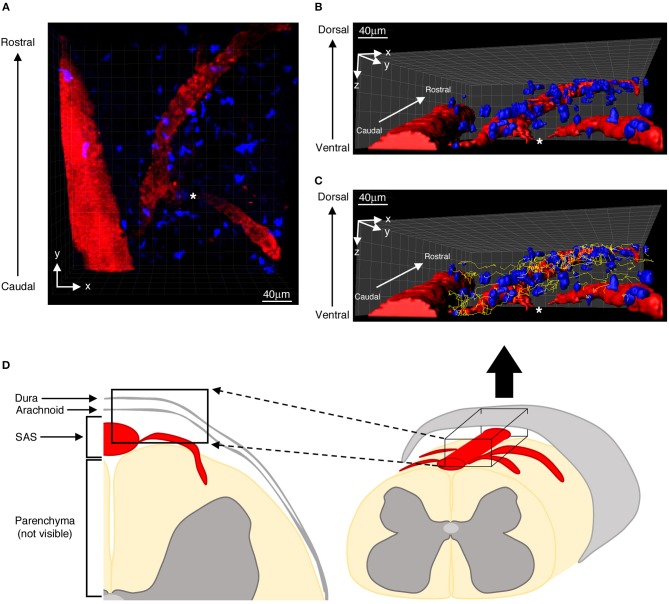
Figure 1.
Distribution of autoreactive T helper cells in the spinal SAS of EAE mice at the disease peak. (A) Representative image of autoreactive Th1 cell distribution (blue) along the same focal plane of SAS pial vessels (red). Three-dimensional reconstitutions of the same image are shown without (B) and with (C) cell tracking projections (yellow lines) based on a monitoring duration of 30 min. (D) Schematic representation of a mouse spinal cord, highlighting the region scanned during our TPLM imaging experiments (black box). The asterisk indicates the region where the blood vessel creeps into the white matter, becoming non-detectable to our imaging system.

