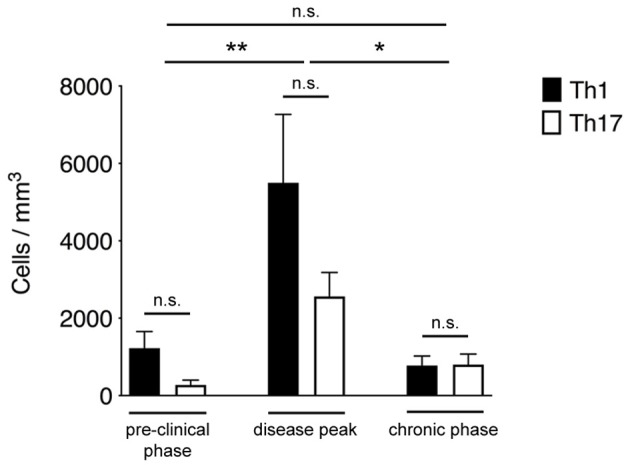
Figure 2.

Quantification of Th1 and Th17 cell accumulation in the spinal SAS at different disease stages. MOG35−55-specific Th1 and Th17 cells were injected into EAE mice during the pre-clinical phase (7 dpi), at the disease peak (11–13 dpi) or during the chronic phase (20–23 dpi). TPLM imaging was performed after 48 h. Cells were quantified by manual counting in the field (volume) of acquisition. Data represent the mean ± SEM of six different fields from three independent experiments. Th1 and Th17 cells quantification for each disease stage was compared for statistical significance using the Mann-Whitney test. For comparison between cell accumulation at different disease stages Kruskal-Wallis test was applied (*P < 0.05; **P < 0.01).
