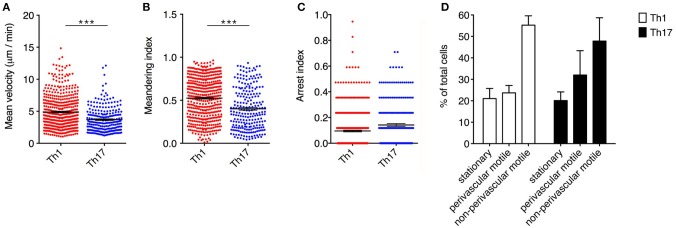
Figure 3.
Dynamics of Th1 and Th17 cell movement inside the spinal SAS at the EAE disease peak. Exogenous myelin-specific autoreactive Th1 and Th17 cells were injected into EAE mice at the disease peak (11–13 dpi). TPLM imaging was performed on the exposed spinal cord 48 h later. The mean velocity (A), meandering index (B) and arrest index (C) were calculated to compare the behavior of infiltrating cells. Data represent the mean ± SEM from a minimum of nine to a maximum of 490 cells from three independent experiments (***P < 0.0001). (D) Comparison of the dynamic behavior of the Th1 and Th17 populations. Data represent the mean ± SEM of six different fields from three independent experiments.

