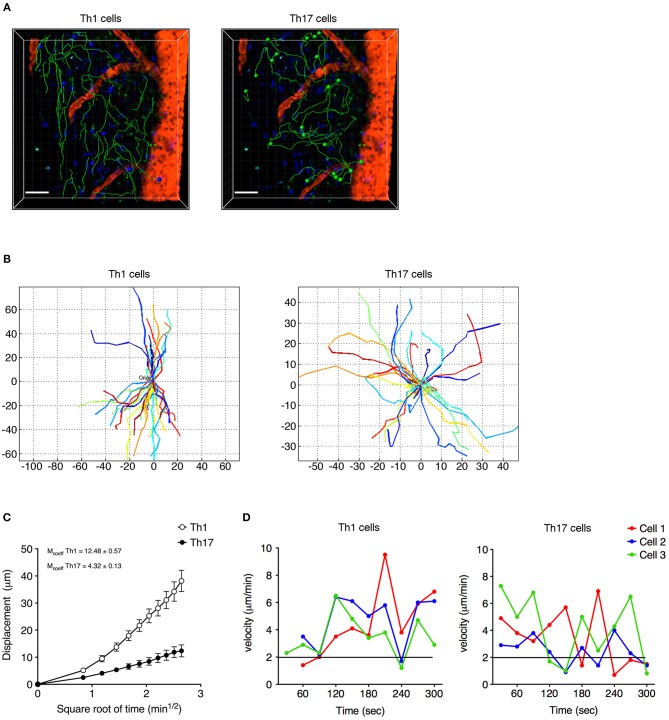
Figure 4.
Non-perivascular motile Th1 and Th17 cell dynamics in the spinal SAS of EAE mice at the disease peak. (A) Representative images of autoreactive Th1 and Th17 cells moving in a dispersed manner in the SAS of EAE mice at the disease peak. Cell tracks (green lines) are also shown (scale bar = 50 μm; red/orange color = blood vessel). Time projections of 30 min are shown. (B) Normalized trajectories of non-perivascular motile Th1 and Th17 cells. (C) Mean displacement of Th1 and Th17 cells. Data represent the mean ± SEM of at least 30 cells from three independent experiments. (D) Instantaneous velocities of three representative Th1 cells (left panel) and Th17 cells (right panel). Cells moving at <2 μm/min were considered non-motile.

