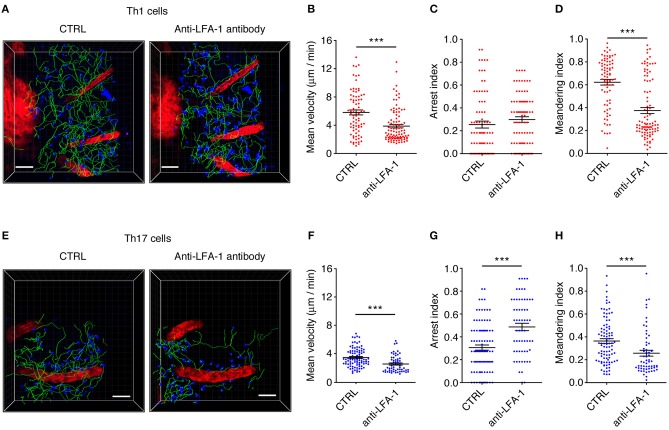
Figure 6.
An LFA-1 blockade differently affects autoreactive Th1 and Th17 cell dynamics in the spinal SAS at the EAE disease peak. Th1 and Th17 cell dynamics were analyzed in the spinal SAS of EAE mice at the disease peak before (CTRL) and after the application of anti-LFA-1 antibodies to the exposed spinal cord. (A) Representative images of Th1 cells moving in the spinal SAS before and after antibody treatment. (B) The mean velocity, (C) arrest index and (D) meandering index of the Th1 cell population in the spinal SAS in the presence or absence of the anti-LFA-1 antibody (***P < 0.0001). (E) Representative images of Th17 cells moving in the spinal SAS before (CTRL) and after antibody treatment. (F) The mean velocity, (G) arrest index and (H) meandering index of Th17 cells in the presence or absence of the anti-LFA-1 antibody (***P < 0.0001). (A,E) Cell tracks (green lines) are also shown (scale bar = 50 μm; red color = blood vessel). Time projections of 30 min are shown. In all graphs, data represent the mean ± SEM of 100 cells from three independent experiments.

