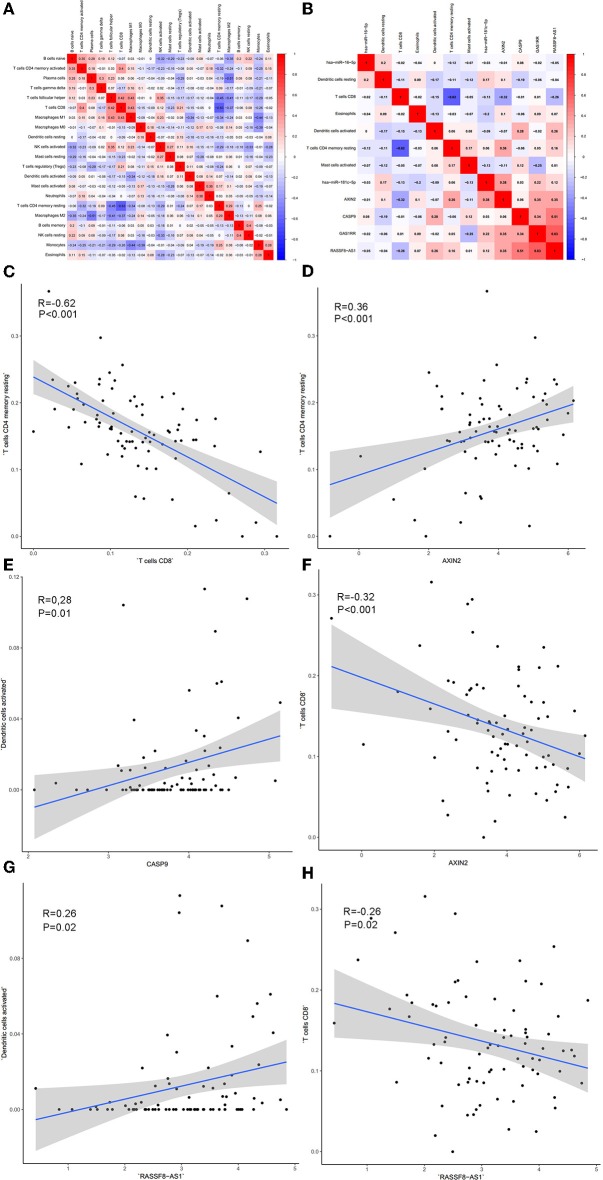
Figure 8.
The co-expression patterns among fractions of immune cells (A); the co-expression patterns among fractions of immune cells and key members in the ceRNA network (B); the relationships among immune cells and between ceRNAs and immune cells were calculated using Pearson correlation coefficients: T cells CD4 memory resting and T cells CD4 (C); T cell CD4 memory resting and AXIN2 (D); Dendritic cells activated and CASP9 (E); T cells CD8 and AXIN2 (F); Dendritic cells activated and RASSF8-AS1 (G); T cells CD8 and RASSF8-AS1 (H).

