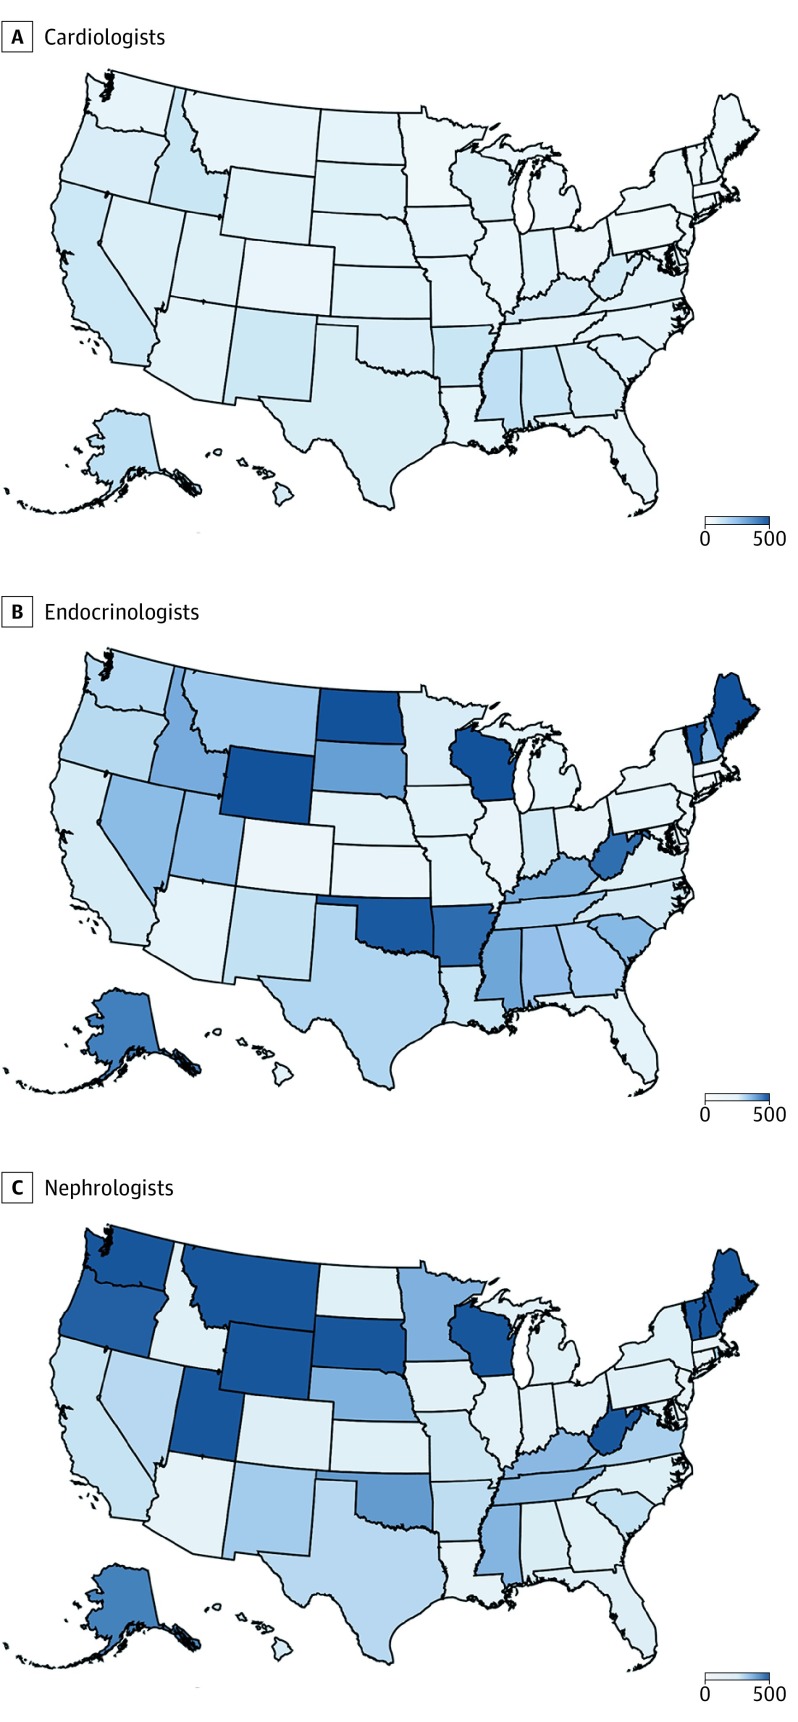
Figure. Density of Newly Diagnosed Cases of Diabetes per Specialist in 2016 Across US States.
A, Cardiologists. The estimates vary from 30:1 to 154:1 across states. B, Endocrinologists. The estimates vary from 37:1 to 667:1 across states. C, Nephrologists. The estimates vary from 46:1 to 2000:1 across states. Density maps of the number of incident diabetes cases per specialist were created using Microsoft Excel with Bing software (GeoNames, HERE, MSFT).

