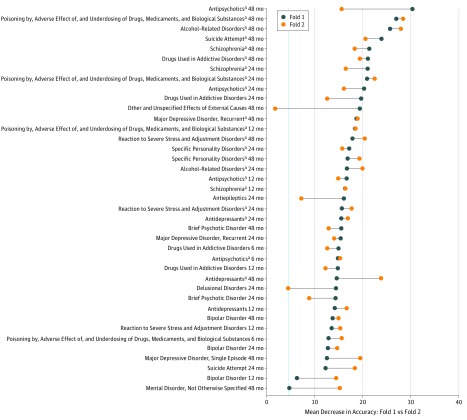
Figure 4. Variable Importance of Suicide Predictors Among Women in Denmark From Split Sample Cross-Validation, 1995-2015.
The blue dots represent the mean decrease in accuracy (MDA) value in fold 1 and the orange dots represent the MDA value in fold 2. The vertical line is the average of the MDA values of all predictors with nonzero MDA values in folds 1 and 2 (4.61).
aPredictors that were in the top 30 predictors in folds 1 and 2 for women.

