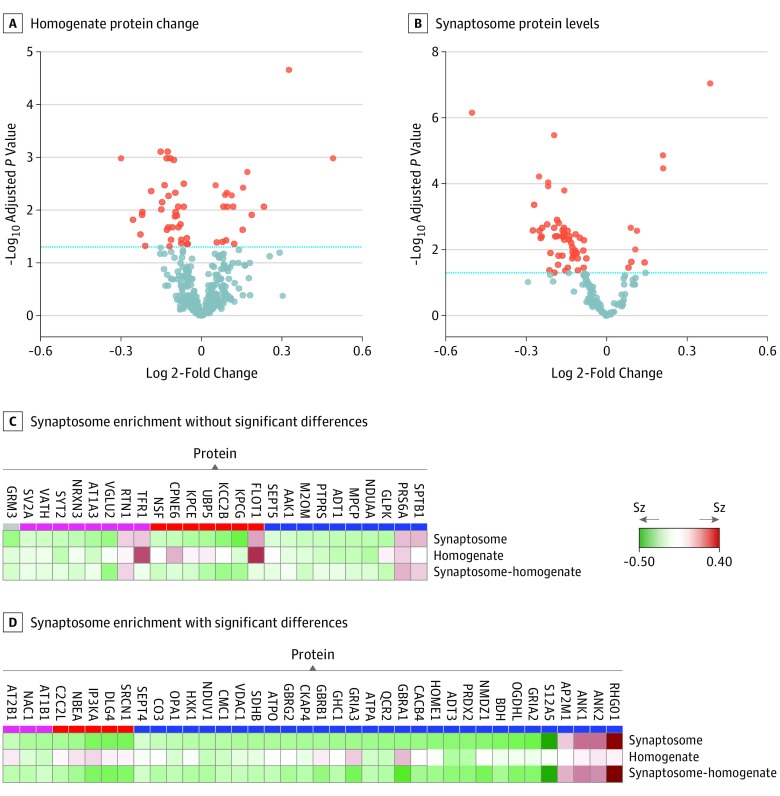
Figure 3. Volcano Plots and Heat Maps of Schizophrenia (Sz) Case-Control Differences.
A and B, Volcano plots chart the − log10 P value and the log 2-fold change (individuals with Sz vs controls) for protein levels of homogenate (of 402 proteins measured, 55 were significant) and synaptosome (of 155 proteins measured, 64 were significant). The blue dashed lines are set at an adjusted Limma P = .05. Heat maps report the fold change (individuals with Sz vs controls) for the 63 significantly altered synaptosome proteins in the synaptosome fraction and the fold-change of those proteins in the homogenate fraction, as well as the synaptosome enrichment values (the ratio of a protein’s synaptosome level to its homogenate level) for each individual. Synaptosome-homogenate rows report the fold change (individuals with Sz vs controls) for this metric. C, Proteins for which the synaptosome enrichment values did not differ significantly between individuals with Sz and controls. D, Proteins for which the synaptosome enrichment values significantly differed between individuals with Sz and controls in the same direction as the synaptosome level changes.

