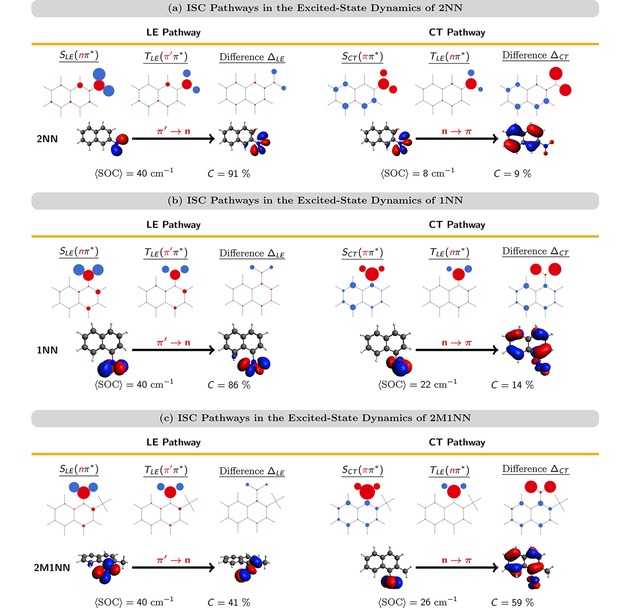
Figure 6.

Characterization of ISC pathways of the nitronaphthalene derivatives 2NN (a), 1NN (b), and 2M1NN (c). Atomic hole‐electron difference populations for the singlet and triplet states involved in the ISC pathways as well as the difference between the populations of both states ▵LE/CT . Below: NTOs involved in the ISC transition. and C denote the size of the average spin‐orbit coupling and the contribution of the ISC pathway, respectively.
