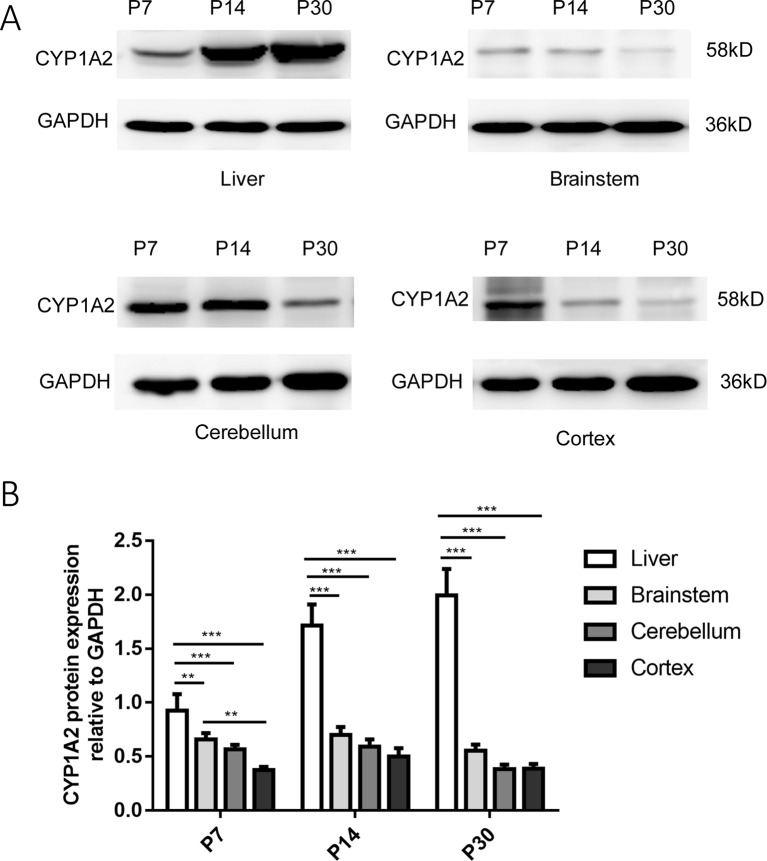
Figure 2.
Expression of CYP1A2 protein in the liver and brain. (A) Representative western blot and relative protein expression in the liver and different regions of the brain. The bands at 58 and 36 kDa correspond to CYP1A2 and GAPDH, respectively. (B) GAPDH protein levels are shown as a control. Expression values of protein levels were normalized to those of GAPDH. Each data point represents the mean ± SD of six samples **p < 0.01, ***p < 0.001. P, postnatal day.

