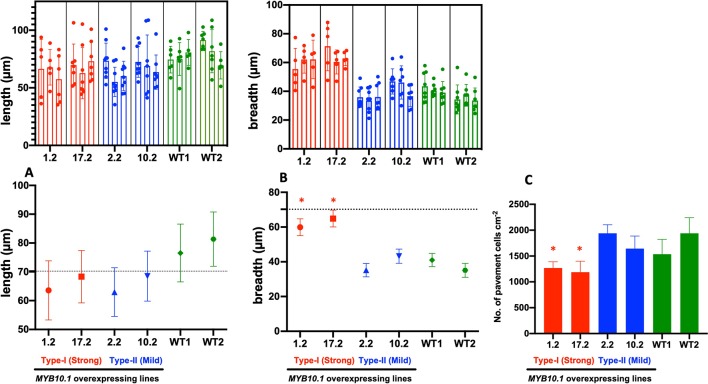
Figure 3.
Analysis of the leaf epidermal (adaxial surface) cells of transgenic tobacco lines. Length of the pavement cells (A), breadth of the pavement cells (B), and number of the pavement cells cm−2 (C) of the tobacco leaf adaxial epidermis. Length and breadth were measured using the ImageJ software program (Schneider et al., 2012) on photographs taken by ESEM. In the top row of panels A and B, data are presented for at least five cells (dots) from each plant (column, mean ± SE) of the three used for each independent line (a block for each line); two lines were used for each phenotype (a different color for each phenotype, red for type I and blue for type II). In the bottom row, values are averaged according to the lines (mean ± SD), with the same color code as in the top row. Panel C describes the density of pavement cells per surface unit. In this case, data are presented only per single line. Asterisks indicate statistically different values (P < 0.05) from WT with a nested one-way analysis of variance test.

